Ameren Corporation AEE
Revenue Intelligence Report • 70 quarters of SEC filing data • Updated 2026-03-15
Revenue is expected to rise about 21% year over year to roughly $12.8 billion as regulated rate actions and steady demand in its utility footprint support topline gains. Our econometric model with time-varying coefficients shows SG&A spending becoming more productive, with elasticity rising from about 0.49x to 0.89x over the history, meaning incremental SG&A dollars contribute more to revenue than in the past. The model's forecast track record is solid—MAPE around 4.2% and a holdout miss of 3.9% on a quarterly forecast of about $1.9 billion versus actual $1.8 billion—reflecting reasonable reliability for planning. Key risk remains regulatory rate-case developments and weather-driven demand volatility that could temper the trajectory.
Investment Thesis
The econometric model achieves strong accuracy (4.2% MAPE), suggesting Ameren Corporation's revenue trajectory is well-characterized by its spending patterns. Sales & marketing spend shows a 0.57x elasticity, suggesting effective go-to-market execution.
Revenue Forecast
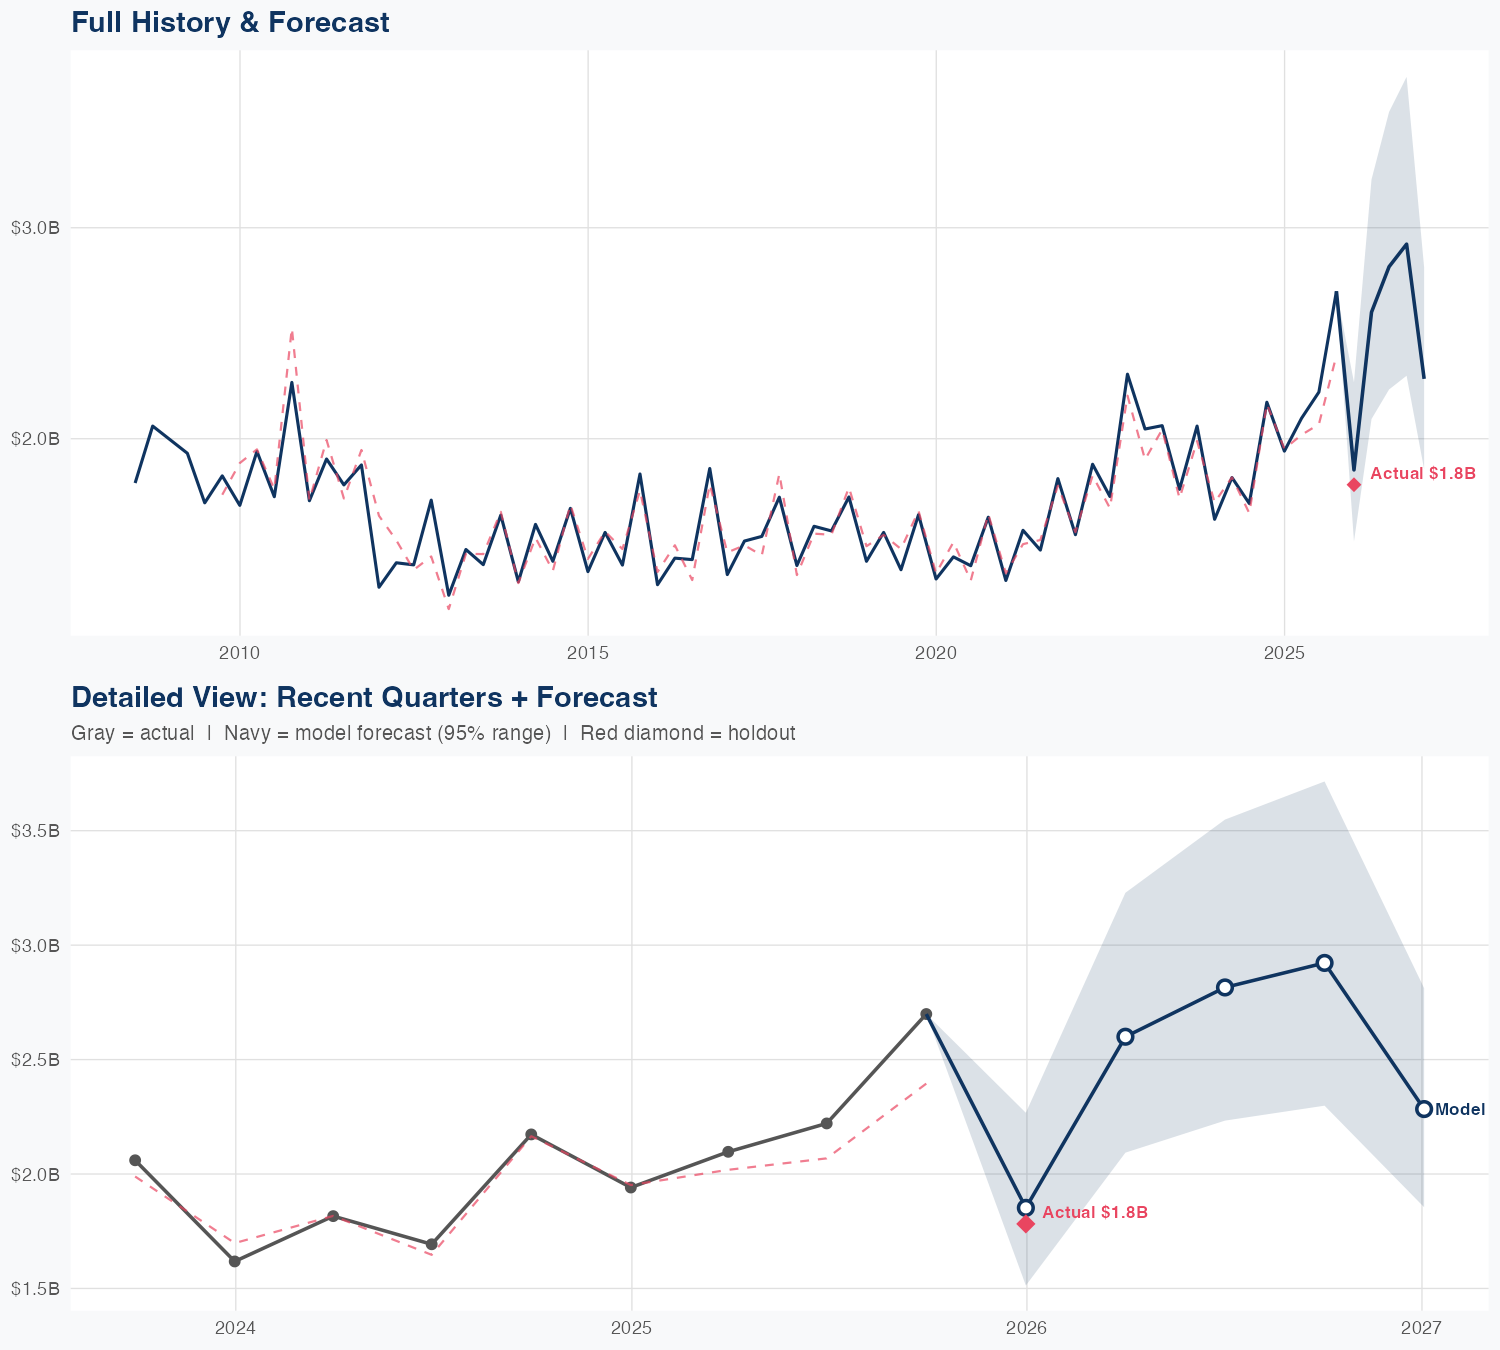
Quarterly Detail
| Quarter | Model Forecast | Actual | 95% Range | YoY Growth | Status |
|---|---|---|---|---|---|
| Q4 2025 | $1.9B | $1.8B | $1.5B – $2.3B | -4.6% | ✓ In range |
| Q2 2026 | $2.6B | $2.1B – $3.2B | +24.0% | ||
| Q3 2026 | $2.8B | $2.2B – $3.5B | +26.8% | ||
| Q4 2026 | $2.9B | $2.3B – $3.7B | +8.3% | ||
| Q1 2027 | $2.3B | $1.9B – $2.8B | +28.2% |
Seasonal Factors
| Fiscal Quarter | Seasonal Factor | vs Trend | Interpretation | Obs. |
|---|---|---|---|---|
| FQ1 (Sep–Nov) | 1.0036 | +0.4% | In line with trend | 17 |
| FQ2 (Dec–Feb) | 0.9801 | -2.0% | In line with trend | 17 |
| FQ3 (Mar–May) | 1.0091 | +0.9% | In line with trend | 16 |
| FQ4 (Jun–Aug) | 1.028 | +2.8% | In line with trend | 16 |
How Spending Drives Revenue
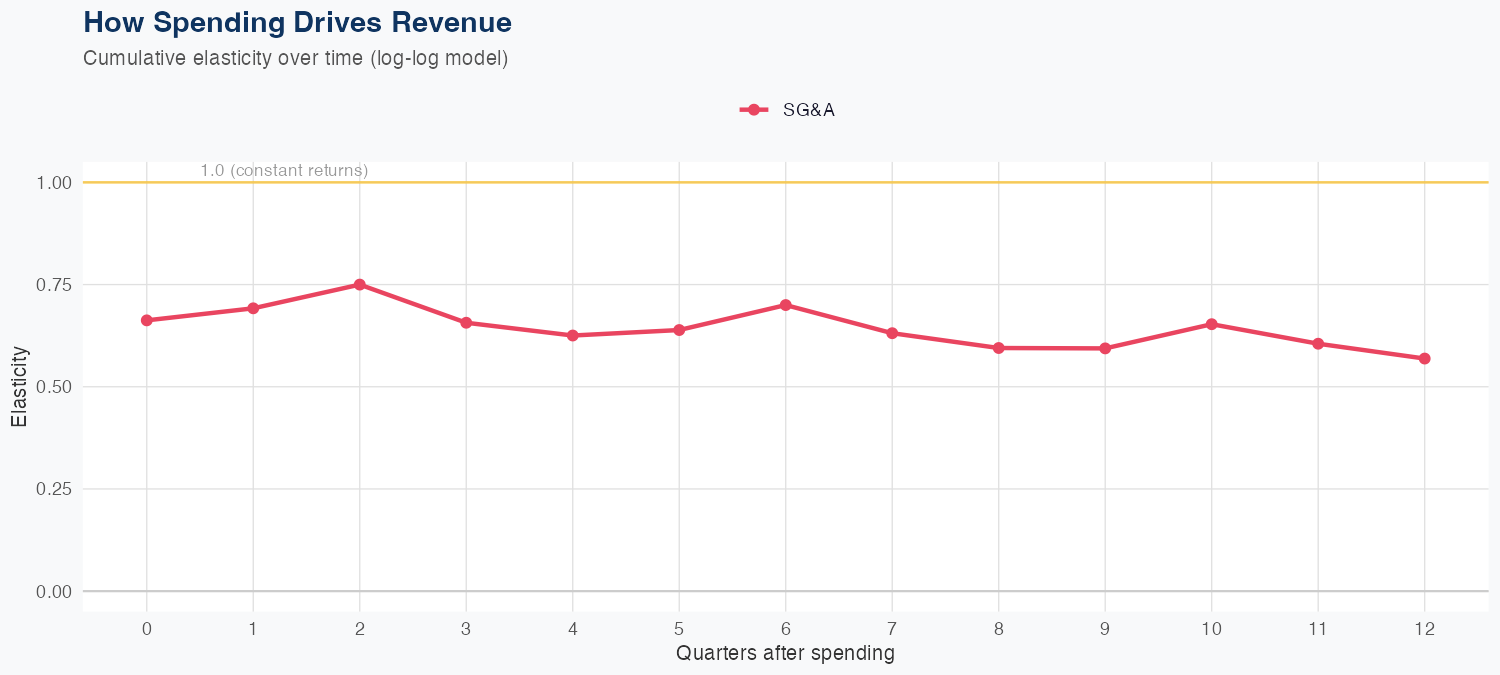
Spending Efficiency Over Time
Current SG&A elasticity: 0.8912x
Want this analysis for your portfolio?
I build custom revenue intelligence reports for investors and companies using SEC filing data, econometric modeling, and AI-powered insights.
Get in Touch