Arthur J. Gallagher & Co. AJG
Revenue Intelligence Report • 17 quarters of SEC filing data • Updated 2026-03-15
AJG's revenue is expected to grow about 5% year over year, taking revenue from about $8.9 billion this year to roughly $9.4 billion next year as structural platform growth sustains momentum and demand for risk management services remains resilient. Our econometric model indicates the binding constraint on further growth is delivery capacity—specifically, the ability to scale broker headcount and client-serving operations to onboard and service additional accounts. Elasticities show SG&A impact is modest and trending lower while R&D is neutral or negative, implying growth is increasingly driven by platform scale and pricing power rather than incremental spending. With structural growth contributing around 45% of the growth, the path to faster expansion hinges on expanding capacity rather than just deploying more spend. Key risk: if talent recruitment and onboarding lag demand, revenue growth could decelerate despite favorable structural tailwinds.
Investment Thesis
Our ARDL model tracks Arthur J. Gallagher & Co.'s revenue with exceptional precision (1.3% MAPE), indicating highly predictable cash flows. R&D spending currently shows a negative elasticity (-8.49x), which can indicate heavy investment in long-cycle initiatives not yet reflected in revenue.
Revenue Forecast
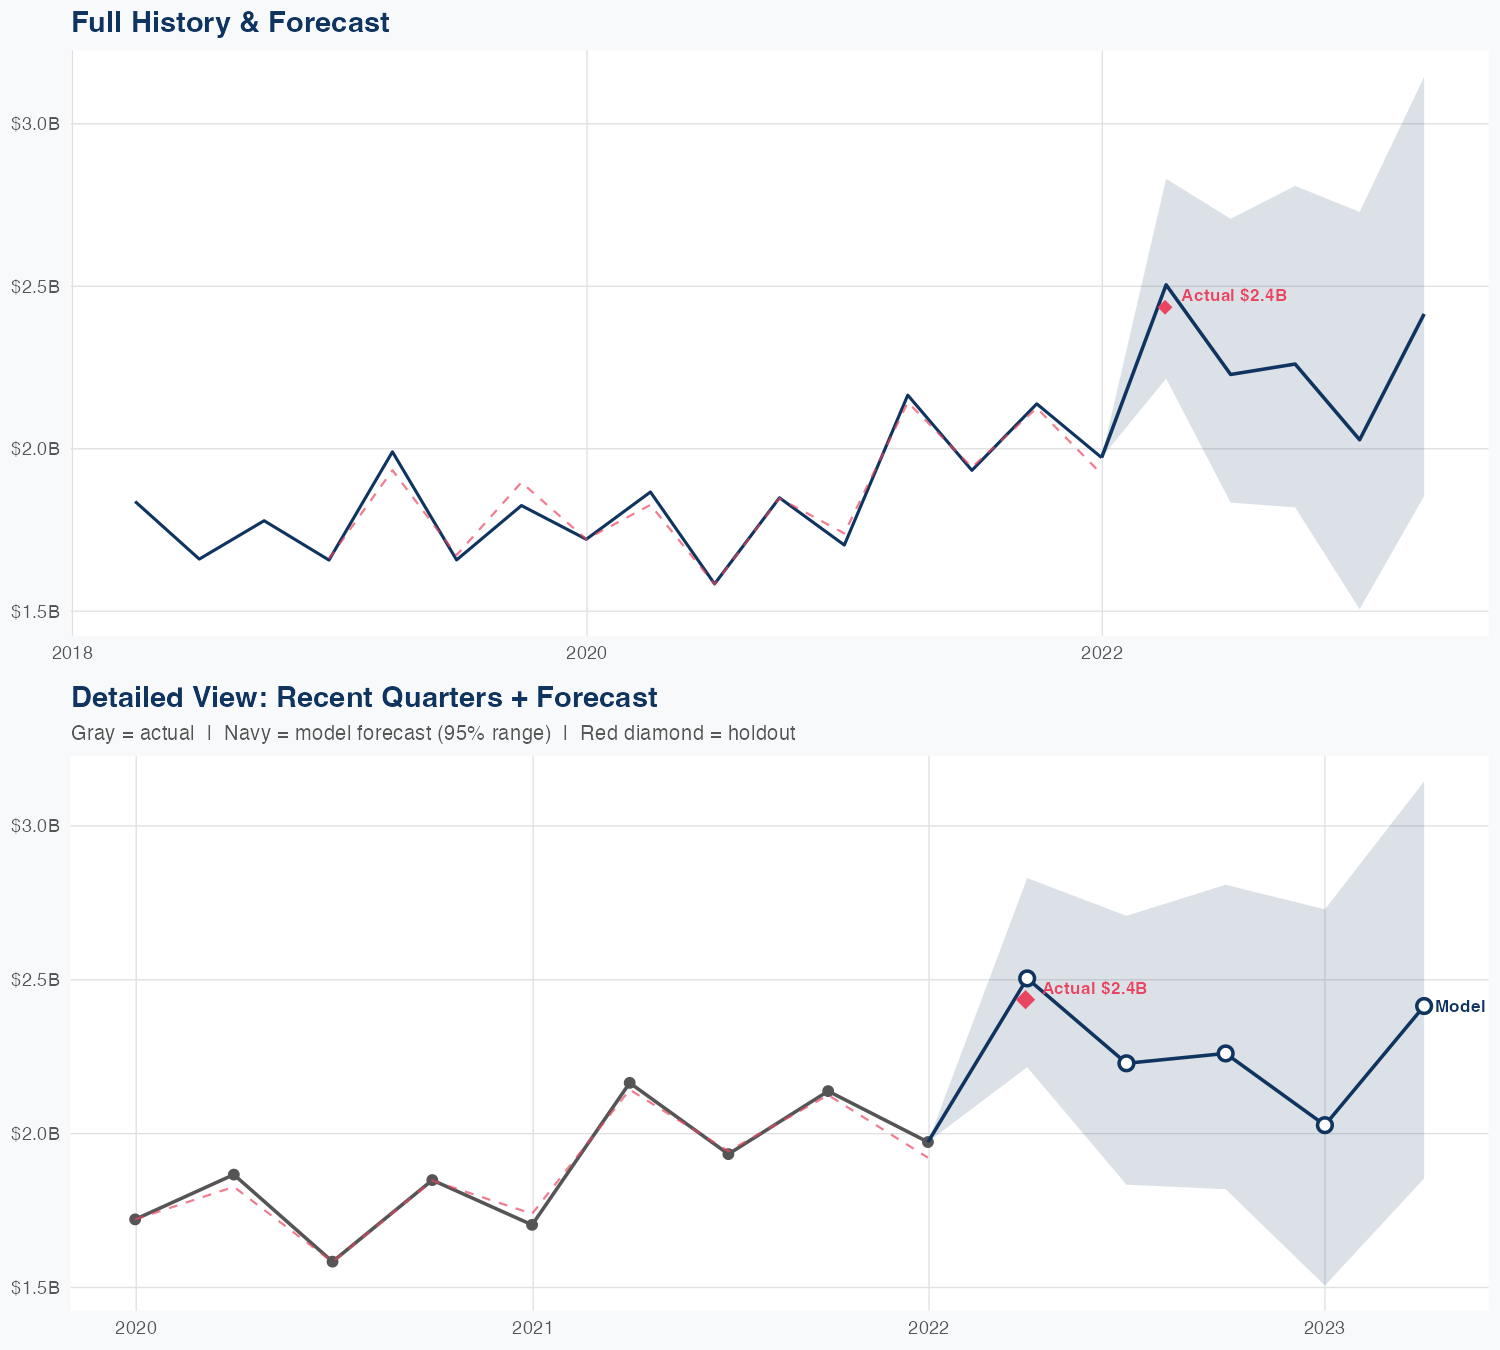
Quarterly Detail
| Quarter | Model Forecast | Actual | 95% Range | YoY Growth | Status |
|---|---|---|---|---|---|
| Q2 2022 | $2.5B | $2.4B | $2.2B – $2.8B | +15.7% | ✓ In range |
| Q3 2022 | $2.2B | $1.8B – $2.7B | +15.3% | ||
| Q4 2022 | $2.3B | $1.8B – $2.8B | +5.7% | ||
| Q1 2023 | $2.0B | $1.5B – $2.7B | +2.8% | ||
| Q2 2023 | $2.4B | $1.9B – $3.1B | -0.8% |
Seasonal Factors
| Fiscal Quarter | Seasonal Factor | vs Trend | Interpretation | Obs. |
|---|---|---|---|---|
| FQ1 (Sep–Nov) | 1.0009 | +0.1% | In line with trend | 3 |
| FQ2 (Dec–Feb) | 1.0 | -0.0% | In line with trend | 4 |
| FQ3 (Mar–May) | 1.0217 | +2.2% | In line with trend | 4 |
| FQ4 (Jun–Aug) | 0.9951 | -0.5% | In line with trend | 3 |
How Spending Drives Revenue
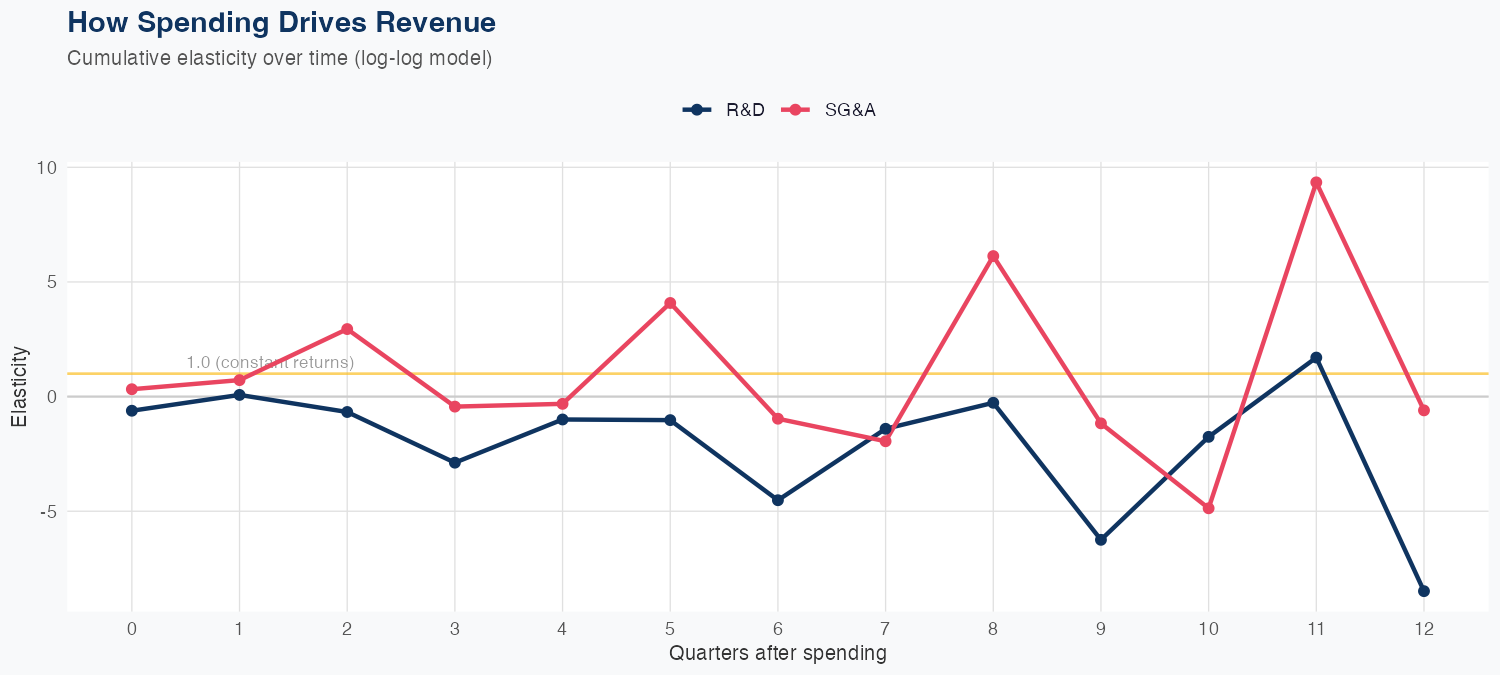
Spending Efficiency Over Time
Current SG&A elasticity: 0.7627x • R&D: -0.856x
Want this analysis for your portfolio?
I build custom revenue intelligence reports for investors and companies using SEC filing data, econometric modeling, and AI-powered insights.
Get in Touch