Ameriprise Financial, Inc. AMP
Revenue Intelligence Report • 70 quarters of SEC filing data • Updated 2026-03-15
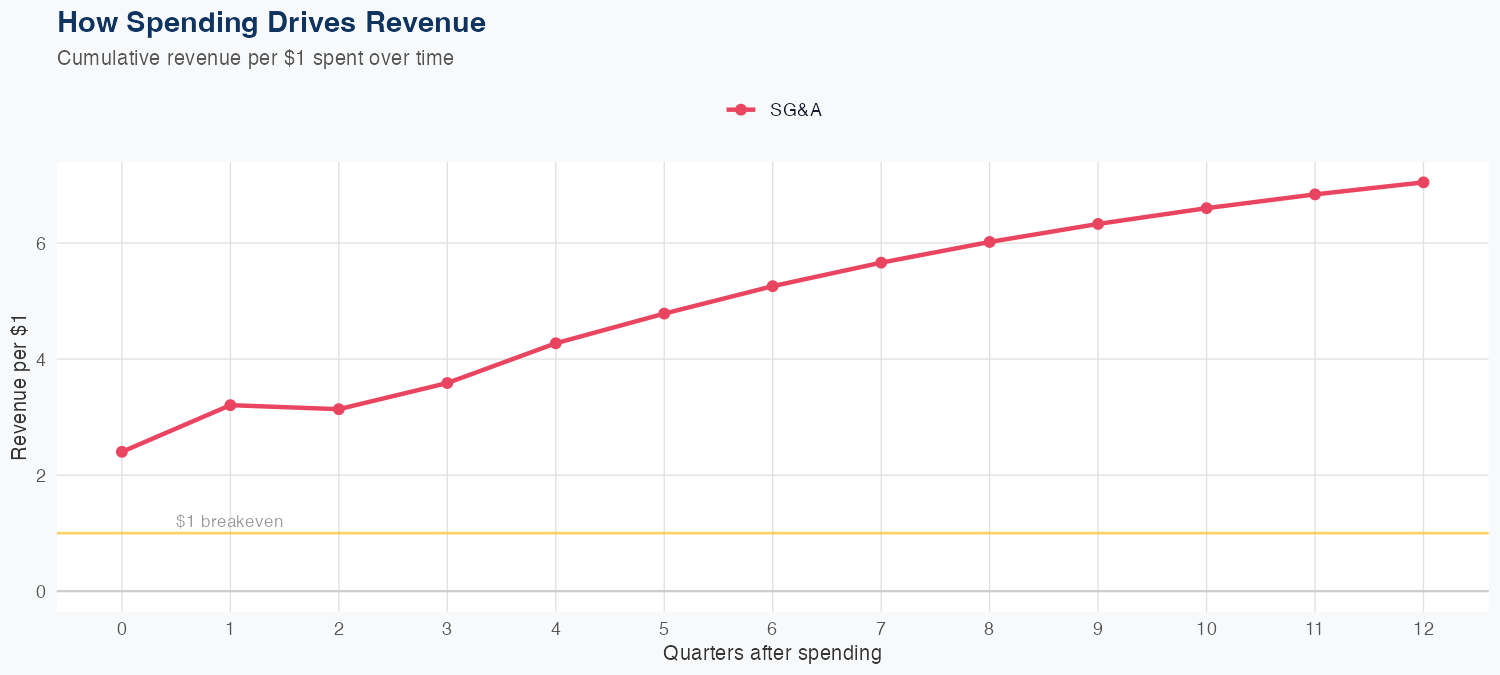
Revenue drivers, per the linear model, are anchored in a strong ROI on SG&A spending: every $1 of SG&A yields $7.05 of long-run revenue. The latest quarterly revenue was $5.047 billion, and the holdout test produced a forecast of $4.7 billion versus actual $5.0 billion (6.4% error), with an in-sample MAPE of 3.5%. The full-year forecast calls for about $18 billion in revenue, down 2.3% year over year, signaling a modest near-term contraction. Overall, investors should view SG&A efficiency as a key driver of long-run revenue, while near-term growth faces headwinds despite the favorable ROI on discretionary spend.
Investment Thesis
The econometric model achieves strong accuracy (3.5% MAPE), suggesting Ameriprise Financial, Inc.'s revenue trajectory is well-characterized by its spending patterns. Each $1 of SG&A spending generates $7.05 in revenue, reflecting strong commercial efficiency.
Revenue Forecast
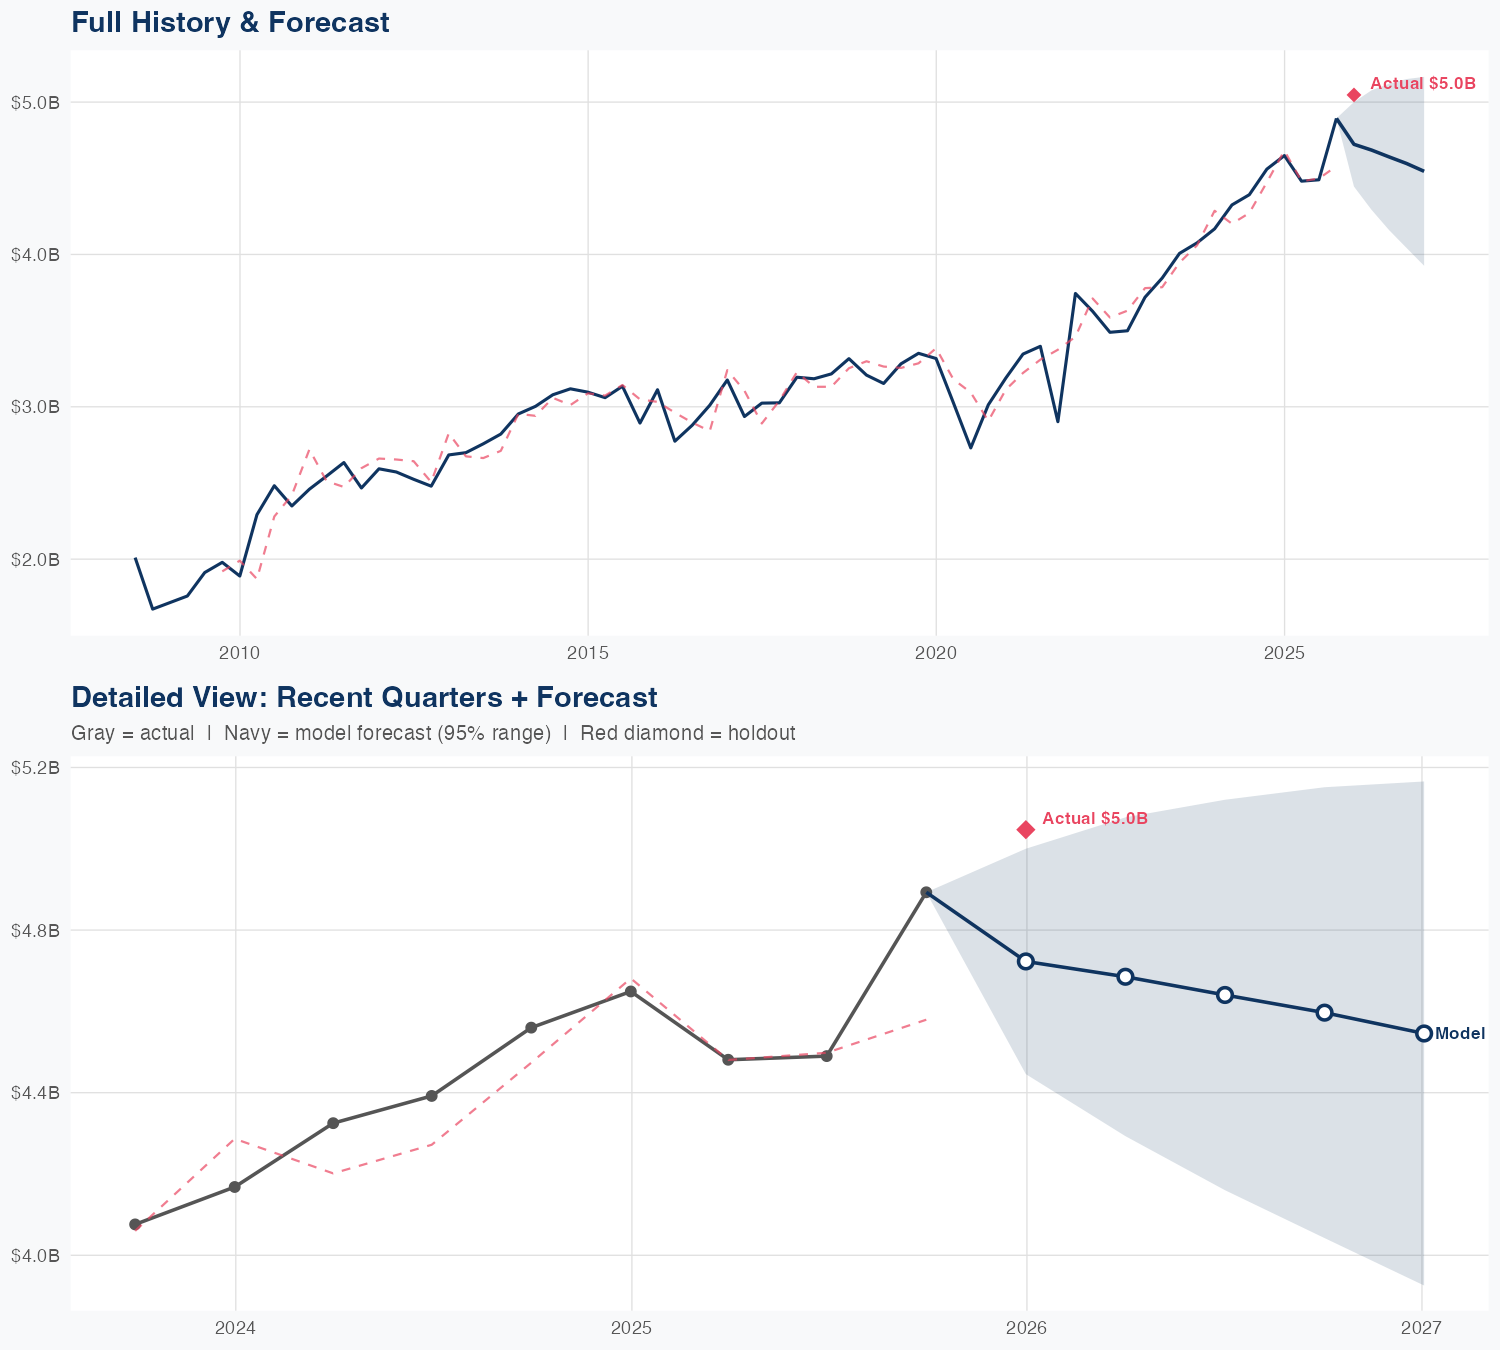
Quarterly Detail
| Quarter | Model Forecast | Actual | 95% Range | YoY Growth | Status |
|---|---|---|---|---|---|
| Q4 2025 | $4.7B | $5.0B | $4.4B – $5.0B | +1.6% | ✗ Outside range |
| Q2 2026 | $4.7B | $4.3B – $5.1B | +4.6% | ||
| Q3 2026 | $4.6B | $4.2B – $5.1B | +3.3% | ||
| Q4 2026 | $4.6B | $4.0B – $5.2B | -6.1% | ||
| Q1 2027 | $4.5B | $3.9B – $5.2B | -9.9% |
Seasonal Factors
| Fiscal Quarter | Seasonal Factor | vs Trend | Interpretation | Obs. |
|---|---|---|---|---|
| FQ1 (Sep–Nov) | 1.0193 | +1.9% | In line with trend | 17 |
| FQ2 (Dec–Feb) | 0.9841 | -1.6% | In line with trend | 17 |
| FQ3 (Mar–May) | 1.0091 | +0.9% | In line with trend | 16 |
| FQ4 (Jun–Aug) | 1.0154 | +1.5% | In line with trend | 16 |
How Spending Drives Revenue
Want this analysis for your portfolio?
I build custom revenue intelligence reports for investors and companies using SEC filing data, econometric modeling, and AI-powered insights.
Get in Touch