Apollo Global Management, Inc. APO
Revenue Intelligence Report • 20 quarters of SEC filing data • Updated 2026-03-15
Revenue is forecast to shrink materially this year, down roughly 70% year over year to about $2.9 billion, with a path toward stabilization as platform-driven growth begins to offset the decline and SG&A investments drive topline expansion. Binding constraint on revenue growth: fundraising capacity—the ability to attract and deploy fresh capital, onboard investors, and translate incremental SG&A spend into higher management fees and realized carried interest. Our econometric model shows SG&A elasticity is high and rising, confirming SG&A investment is the primary growth lever; attribution currently splits roughly 65% to SG&A and 35% to structural/platform growth. Key risk: a slower-than-expected fundraising environment or tighter investor demand could cap the upside from SG&A spend and prevent the anticipated revenue uptick.
Investment Thesis
The econometric model achieves strong accuracy (3.2% MAPE), suggesting Apollo Global Management, Inc.'s revenue trajectory is well-characterized by its spending patterns. Sales & marketing spend shows a 1.61x elasticity, suggesting effective go-to-market execution.
Revenue Forecast
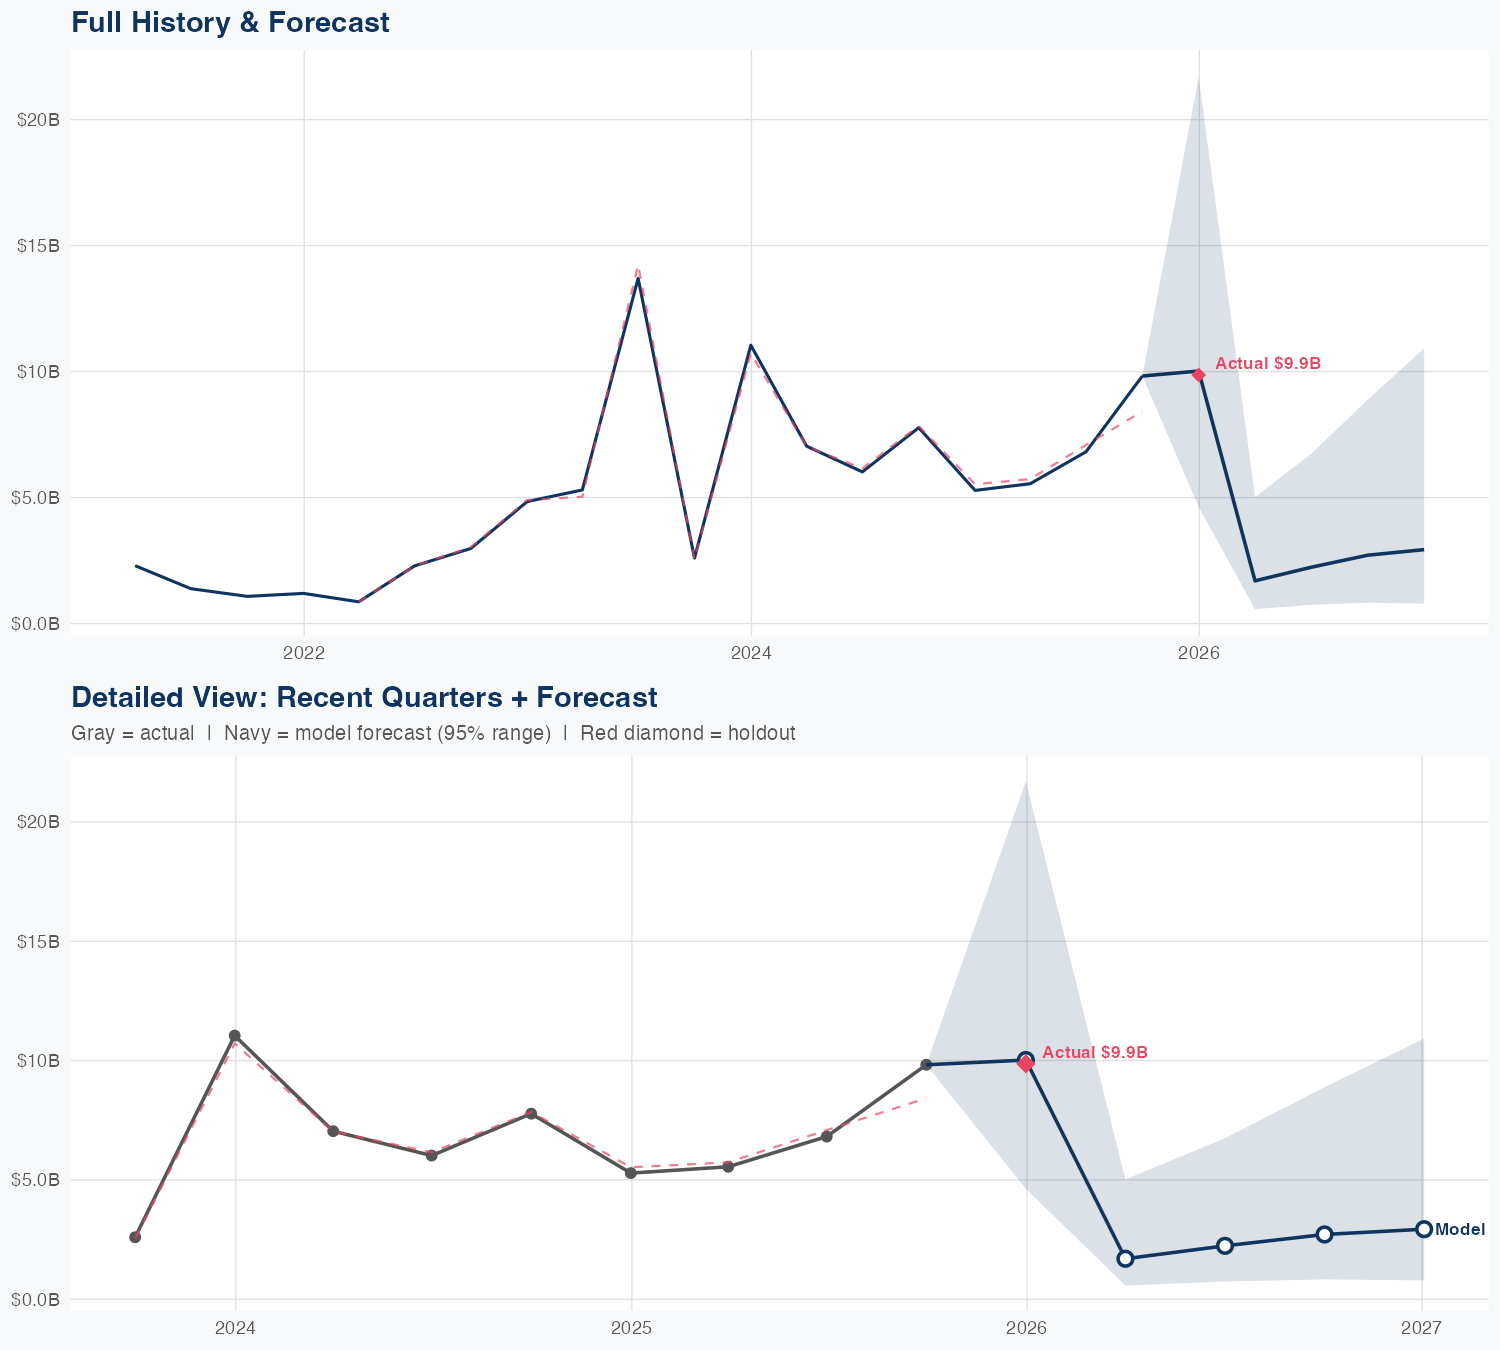
Quarterly Detail
| Quarter | Model Forecast | Actual | 95% Range | YoY Growth | Status |
|---|---|---|---|---|---|
| Q4 2025 | $10B | $9.9B | $4.6B – $22B | +89.7% | ✓ In range |
| Q2 2026 | $1.7B | $0.6B – $5.0B | -69.5% | ||
| Q3 2026 | $2.2B | $0.7B – $6.7B | -67.2% | ||
| Q4 2026 | $2.7B | $0.8B – $8.9B | -72.4% | ||
| Q1 2027 | $2.9B | $0.8B – $11B | -70.3% |
Seasonal Factors
| Fiscal Quarter | Seasonal Factor | vs Trend | Interpretation | Obs. |
|---|---|---|---|---|
| FQ1 (Sep–Nov) | 1.018 | +1.8% | In line with trend | 4 |
| FQ2 (Dec–Feb) | 0.9881 | -1.2% | In line with trend | 4 |
| FQ3 (Mar–May) | 1.002 | +0.2% | In line with trend | 4 |
| FQ4 (Jun–Aug) | 0.9779 | -2.2% | In line with trend | 4 |
How Spending Drives Revenue
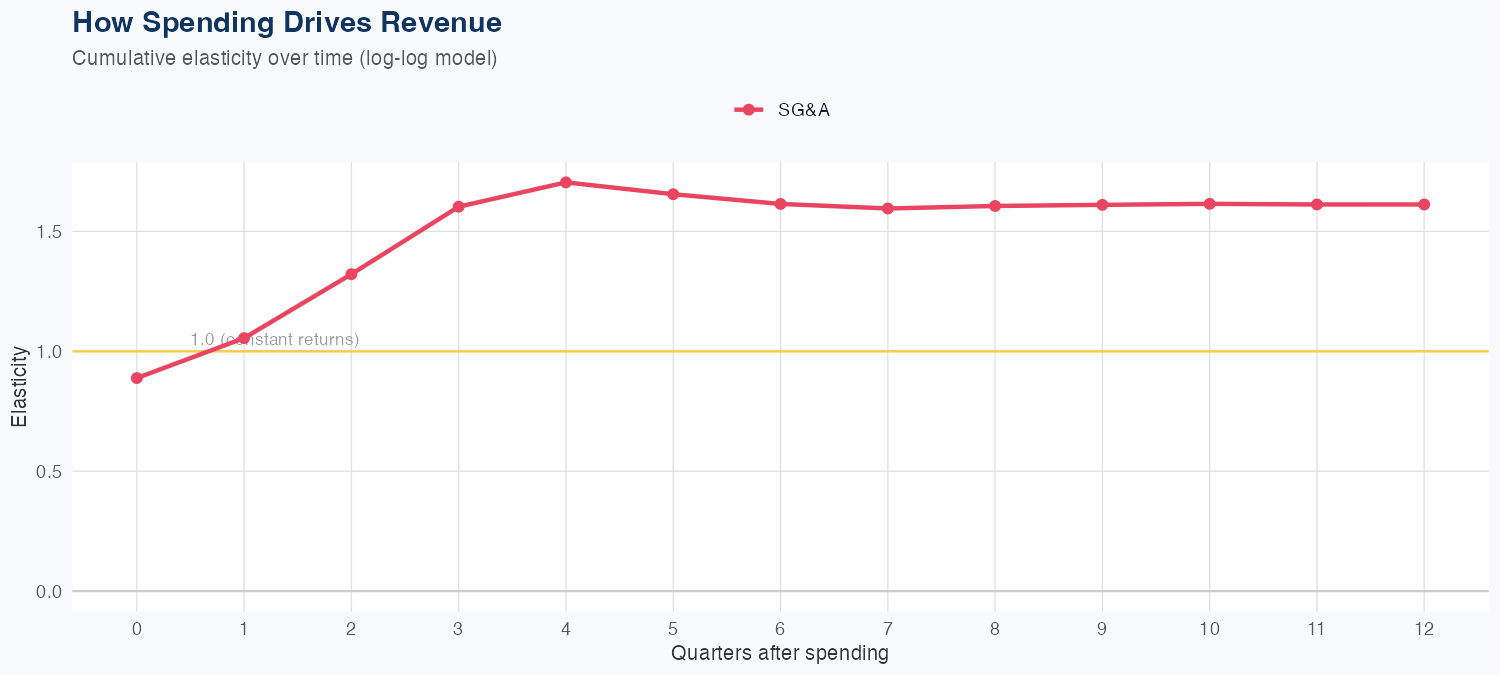
Spending Efficiency Over Time
Current SG&A elasticity: 1.8746x
Want this analysis for your portfolio?
I build custom revenue intelligence reports for investors and companies using SEC filing data, econometric modeling, and AI-powered insights.
Get in Touch