American Water Works Company, Inc. AWK
Revenue Intelligence Report • 66 quarters of SEC filing data • Updated 2026-03-15
Revenue is forecast to grow roughly 9.5% year over year to about $6.1 billion, driven by structural growth and pricing power within AWK’s regulated footprint. The binding constraint on growth is regulatory rate-case timing and the scope of allowed rate increases, which cap revenue growth even as operating leverage improves. Revenue growth is split roughly 49% from structural/platform effects and 51% from SG&A leverage, with R&D contributing essentially nothing. Key risk: regulatory delays or unfavorable rate-case decisions that limit allowed revenue and capex, potentially dampening the upside.
Investment Thesis
Our ARDL model tracks American Water Works Company, Inc.'s revenue with exceptional precision (2.9% MAPE), indicating highly predictable cash flows. Sales & marketing spend shows a 0.94x elasticity, suggesting effective go-to-market execution.
Revenue Forecast
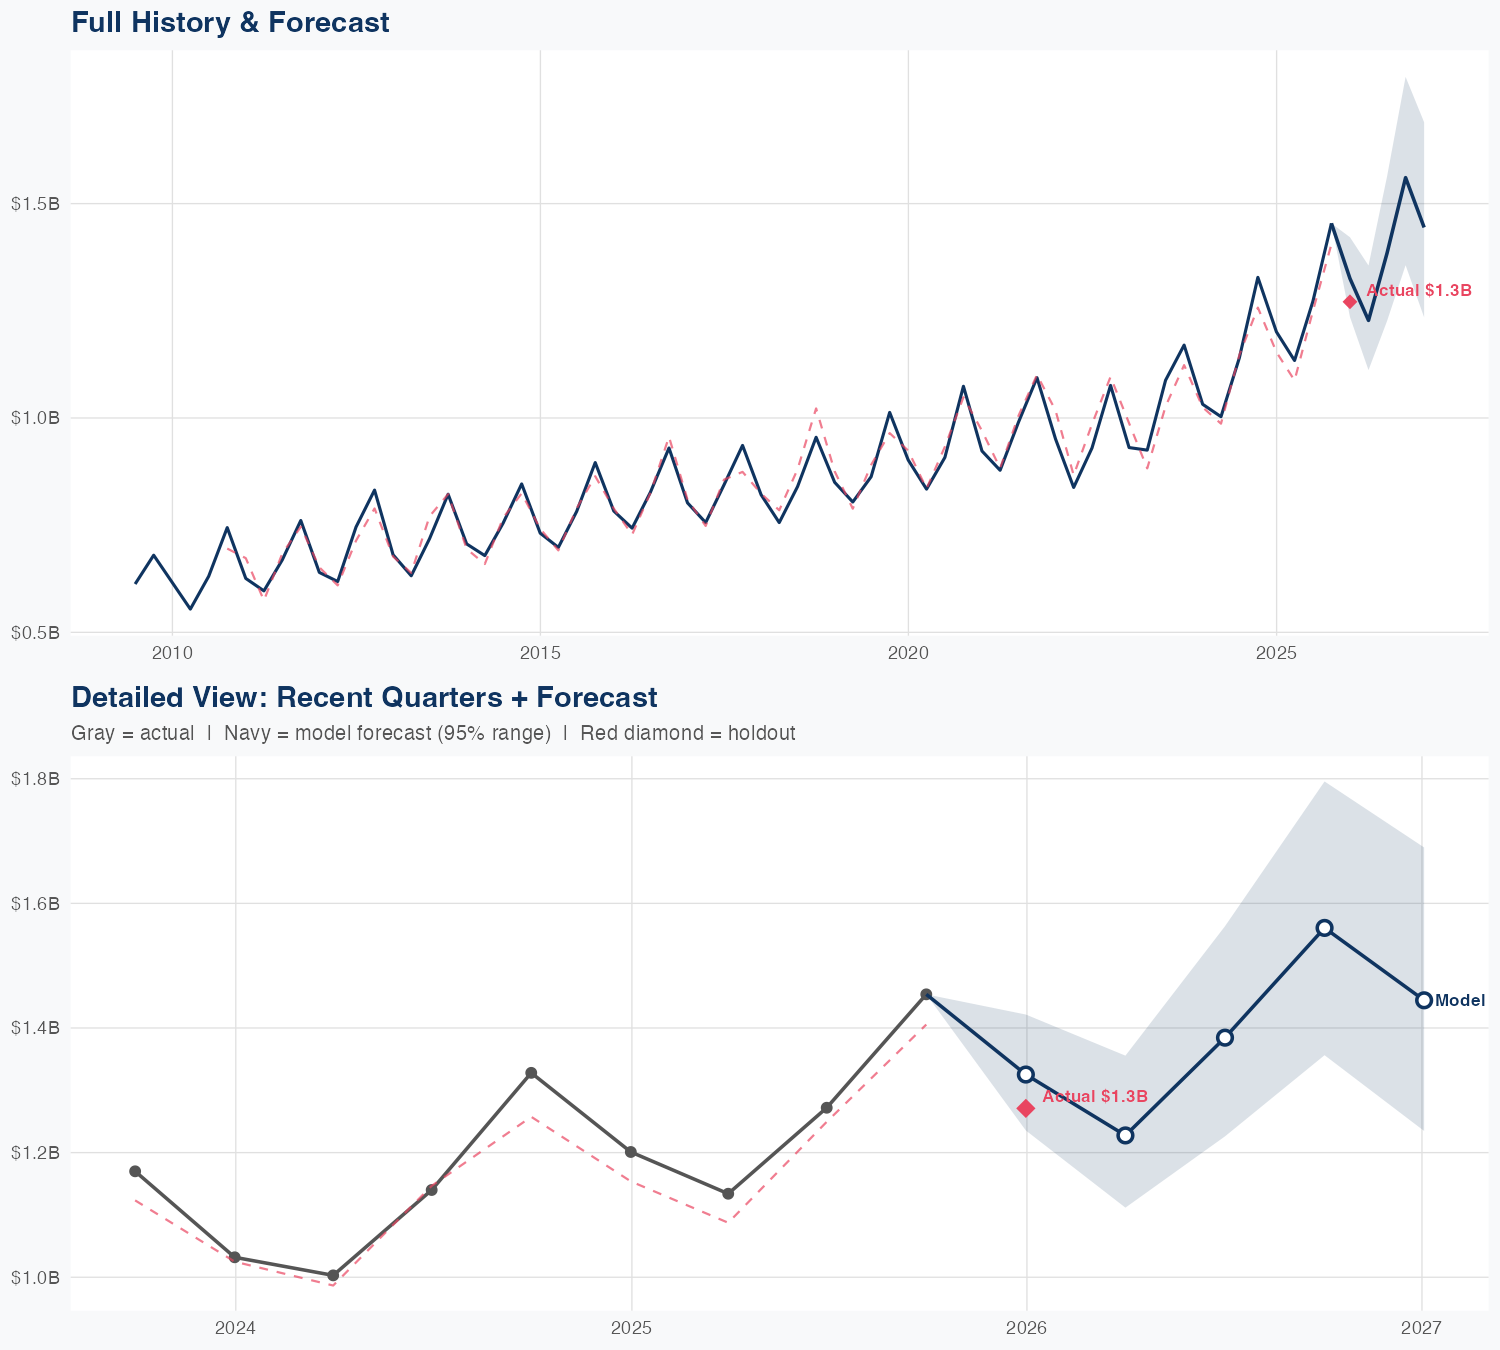
Quarterly Detail
| Quarter | Model Forecast | Actual | 95% Range | YoY Growth | Status |
|---|---|---|---|---|---|
| Q4 2025 | $1.3B | $1.3B | $1.2B – $1.4B | +10.3% | ✓ In range |
| Q2 2026 | $1.2B | $1.1B – $1.4B | +8.3% | ||
| Q3 2026 | $1.4B | $1.2B – $1.6B | +8.8% | ||
| Q4 2026 | $1.6B | $1.4B – $1.8B | +7.3% | ||
| Q1 2027 | $1.4B | $1.2B – $1.7B | +13.6% |
Seasonal Factors
| Fiscal Quarter | Seasonal Factor | vs Trend | Interpretation | Obs. |
|---|---|---|---|---|
| FQ1 (Sep–Nov) | 1.0345 | +3.5% | +3.5% above trend | 16 |
| FQ2 (Dec–Feb) | 0.9862 | -1.4% | In line with trend | 16 |
| FQ3 (Mar–May) | 1.0148 | +1.5% | In line with trend | 15 |
| FQ4 (Jun–Aug) | 0.9851 | -1.5% | In line with trend | 15 |
How Spending Drives Revenue
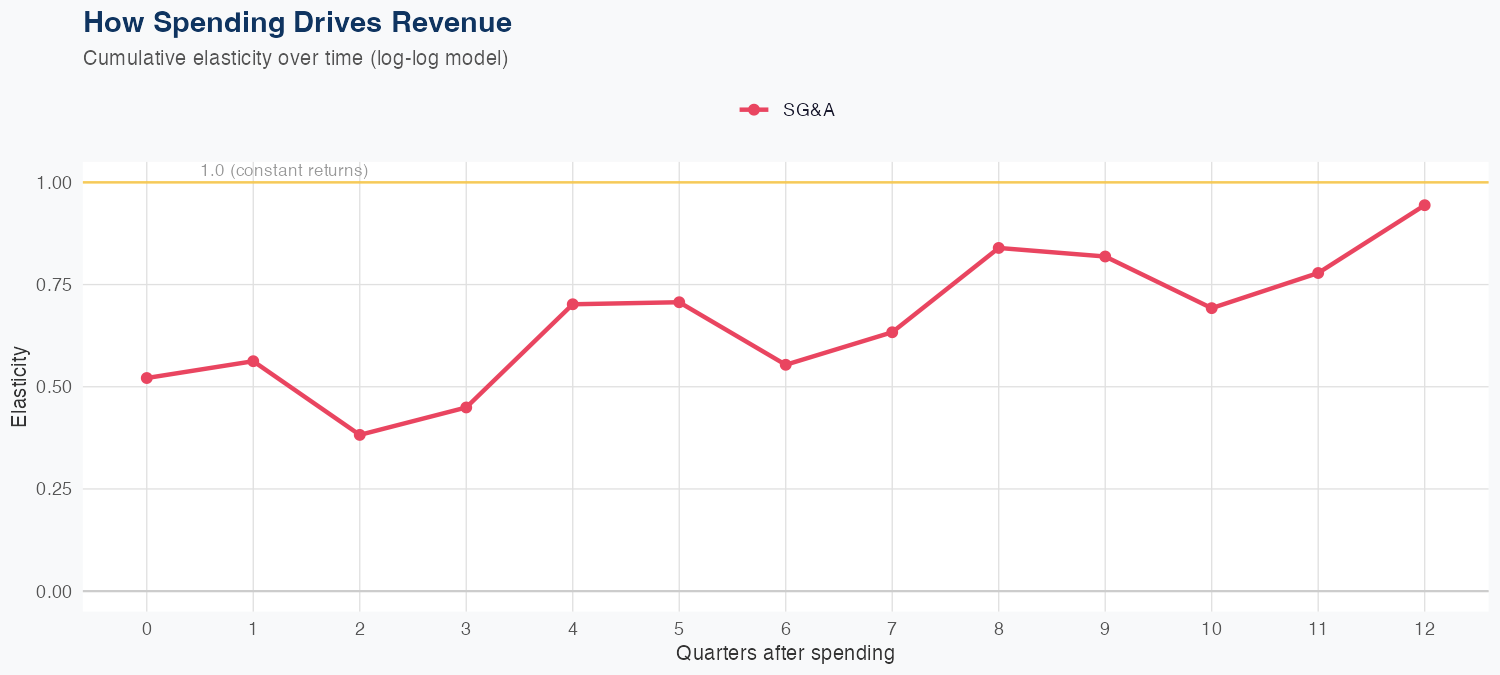
Spending Efficiency Over Time
Current SG&A elasticity: 0.5675x
Want this analysis for your portfolio?
I build custom revenue intelligence reports for investors and companies using SEC filing data, econometric modeling, and AI-powered insights.
Get in Touch