American Express Co AXP
Revenue Intelligence Report • 70 quarters of SEC filing data • Updated 2026-03-15
Revenue is forecast to grow about 24% year over year to roughly $51 billion, with momentum sustained by structural/platform growth and ongoing SG&A investment. Binding constraint: the growth engine hinges on the ability to deploy incremental SG&A—specifically, the marketing and sales resources needed to acquire and activate new cardmembers and merchants. Our view is that the binding constraint is marketing and acquisition capacity—the company’s practical limit to scale SG&A investments and convert them into sustainable revenue growth. Key risk: a softer consumer spending environment or slower travel demand could dampen spend growth even with higher SG&A investment.
Investment Thesis
At 9.5% MAPE, the model captures American Express Co's broad revenue trajectory, though quarterly variability suggests sensitivity to external factors. Sales & marketing spend shows a 1.64x elasticity, suggesting effective go-to-market execution.
Revenue Forecast
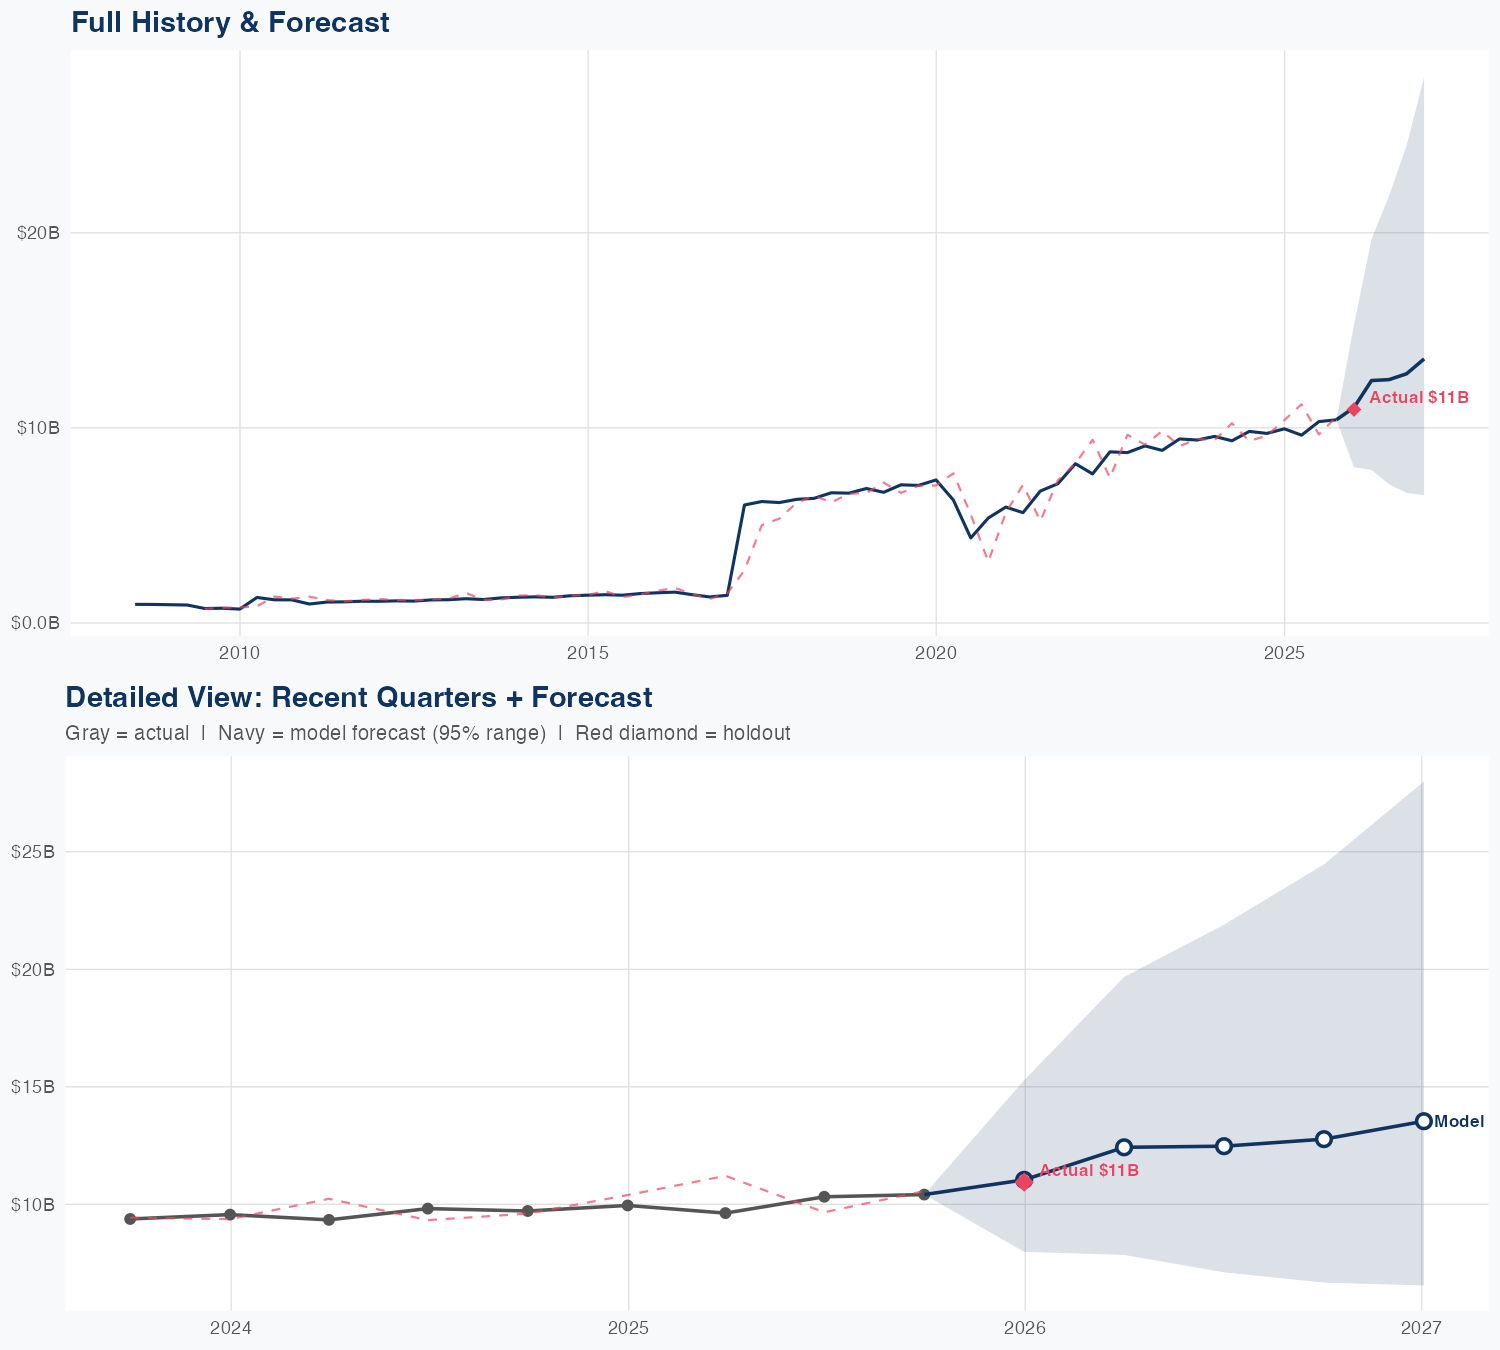
Quarterly Detail
| Quarter | Model Forecast | Actual | 95% Range | YoY Growth | Status |
|---|---|---|---|---|---|
| Q4 2025 | $11B | $11B | $8.0B – $15B | +10.9% | ✓ In range |
| Q2 2026 | $12B | $7.8B – $20B | +29.1% | ||
| Q3 2026 | $12B | $7.1B – $22B | +20.9% | ||
| Q4 2026 | $13B | $6.7B – $24B | +22.6% | ||
| Q1 2027 | $14B | $6.5B – $28B | +23.7% |
Seasonal Factors
| Fiscal Quarter | Seasonal Factor | vs Trend | Interpretation | Obs. |
|---|---|---|---|---|
| FQ1 (Sep–Nov) | 0.994 | -0.6% | In line with trend | 17 |
| FQ2 (Dec–Feb) | 0.9911 | -0.9% | In line with trend | 17 |
| FQ3 (Mar–May) | 0.9109 | -8.9% | -8.9% below trend | 16 |
| FQ4 (Jun–Aug) | 1.041 | +4.1% | +4.1% above trend | 17 |
How Spending Drives Revenue
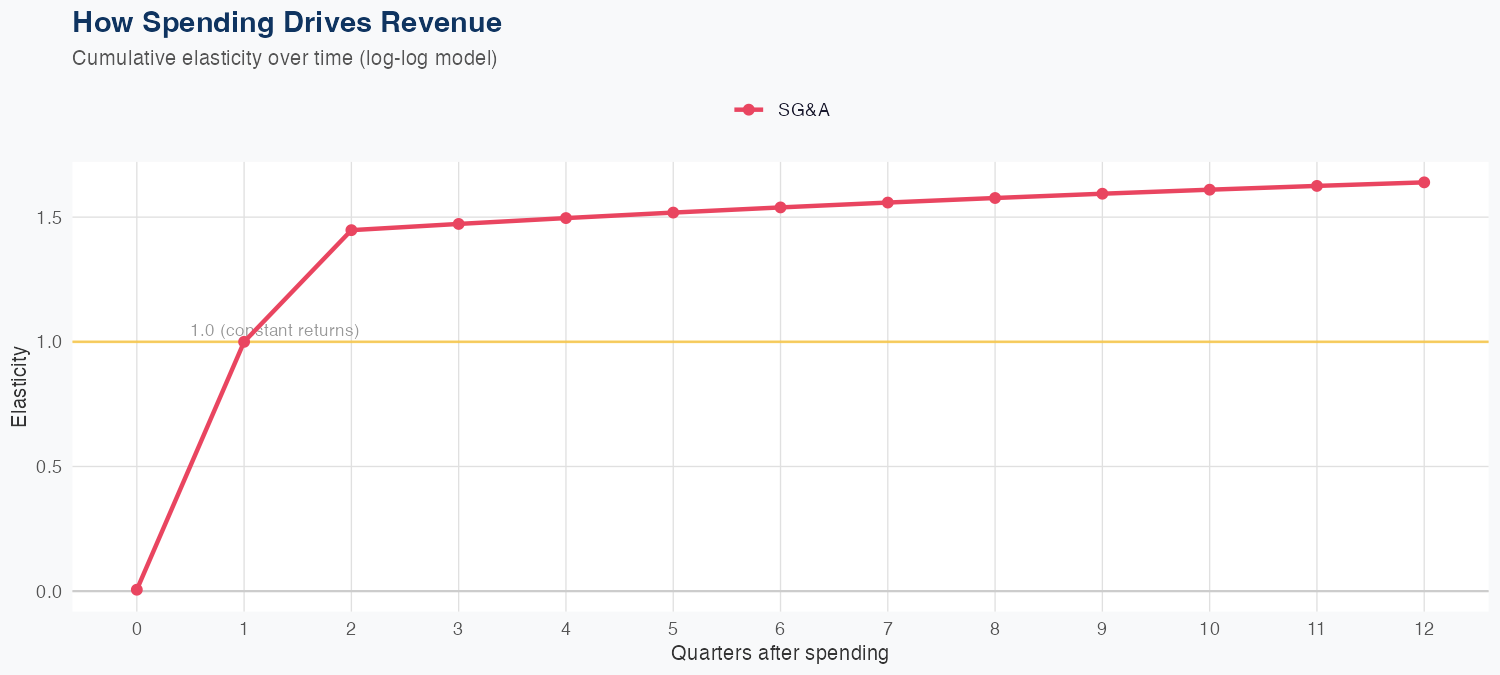
Spending Efficiency Over Time
Current SG&A elasticity: 0.8006x
Want this analysis for your portfolio?
I build custom revenue intelligence reports for investors and companies using SEC filing data, econometric modeling, and AI-powered insights.
Get in Touch