Bank of America Corporation BAC
Revenue Intelligence Report • 70 quarters of SEC filing data • Updated 2026-03-15
Revenue is forecast to grow about 6.4% year over year, taking FY revenue to roughly $127 billion as Bank of America benefits from solid lending, higher deposits, and steady fee income. Our econometric model shows this growth is not driven by SG&A spending; SG&A elasticity has shifted from about 0.4x to negative 0.7x, signaling rising operating leverage and growth from scale and recurring revenue. Our econometric model uses time-varying coefficients and holdout tests show predicted $28.9B versus actual $31.2B, a ~7% miss, with an overall MAPE near 6.6%. Risk: macro volatility and net interest margin dynamics could temper the upside.
Investment Thesis
The econometric model achieves strong accuracy (6.6% MAPE), suggesting Bank of America Corporation's revenue trajectory is well-characterized by its spending patterns.
Revenue Forecast
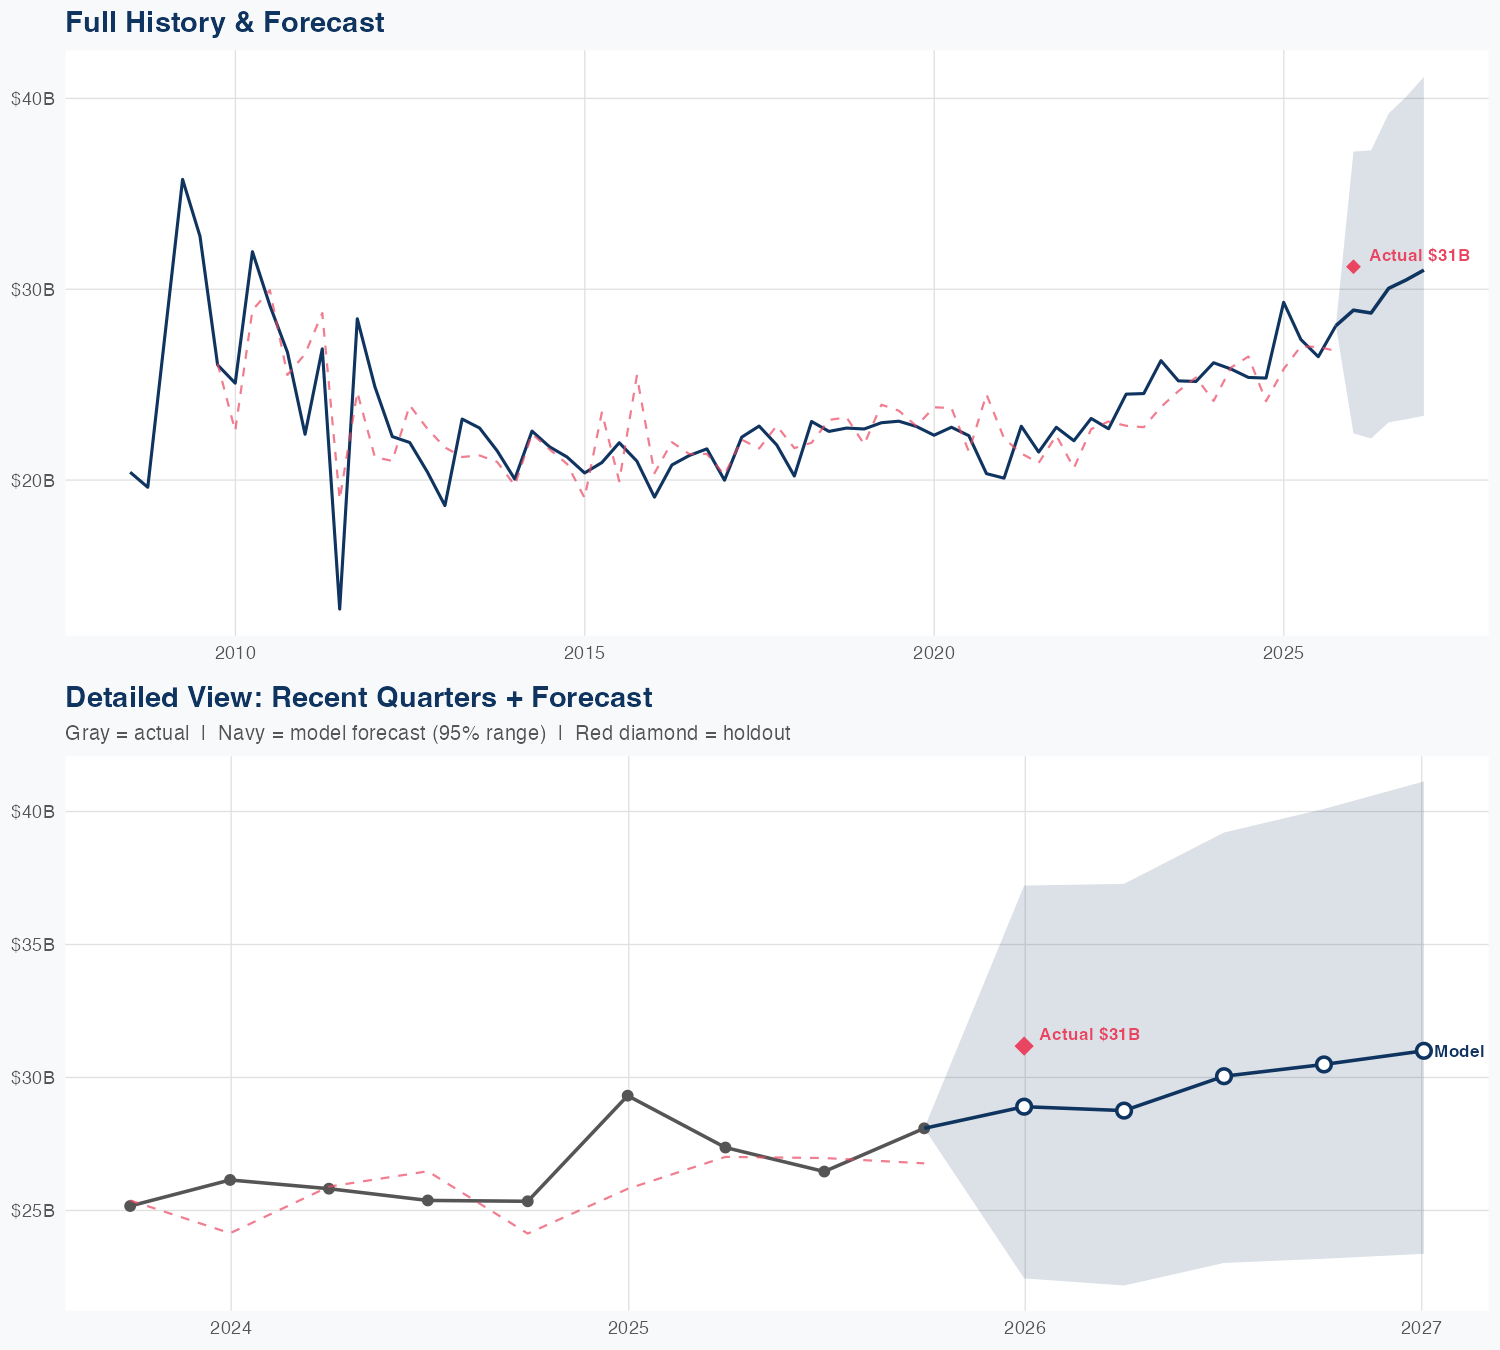
Quarterly Detail
| Quarter | Model Forecast | Actual | 95% Range | YoY Growth | Status |
|---|---|---|---|---|---|
| Q4 2025 | $29B | $31B | $22B – $37B | -1.4% | ✓ In range |
| Q2 2026 | $29B | $22B – $37B | +5.1% | ||
| Q3 2026 | $30B | $23B – $39B | +13.5% | ||
| Q4 2026 | $30B | $23B – $40B | +8.6% | ||
| Q1 2027 | $31B | $23B – $41B | -0.6% |
Seasonal Factors
| Fiscal Quarter | Seasonal Factor | vs Trend | Interpretation | Obs. |
|---|---|---|---|---|
| FQ1 (Sep–Nov) | 1.0126 | +1.3% | In line with trend | 17 |
| FQ2 (Dec–Feb) | 1.0367 | +3.7% | +3.7% above trend | 17 |
| FQ3 (Mar–May) | 1.013 | +1.3% | In line with trend | 16 |
| FQ4 (Jun–Aug) | 0.9964 | -0.4% | In line with trend | 16 |
How Spending Drives Revenue
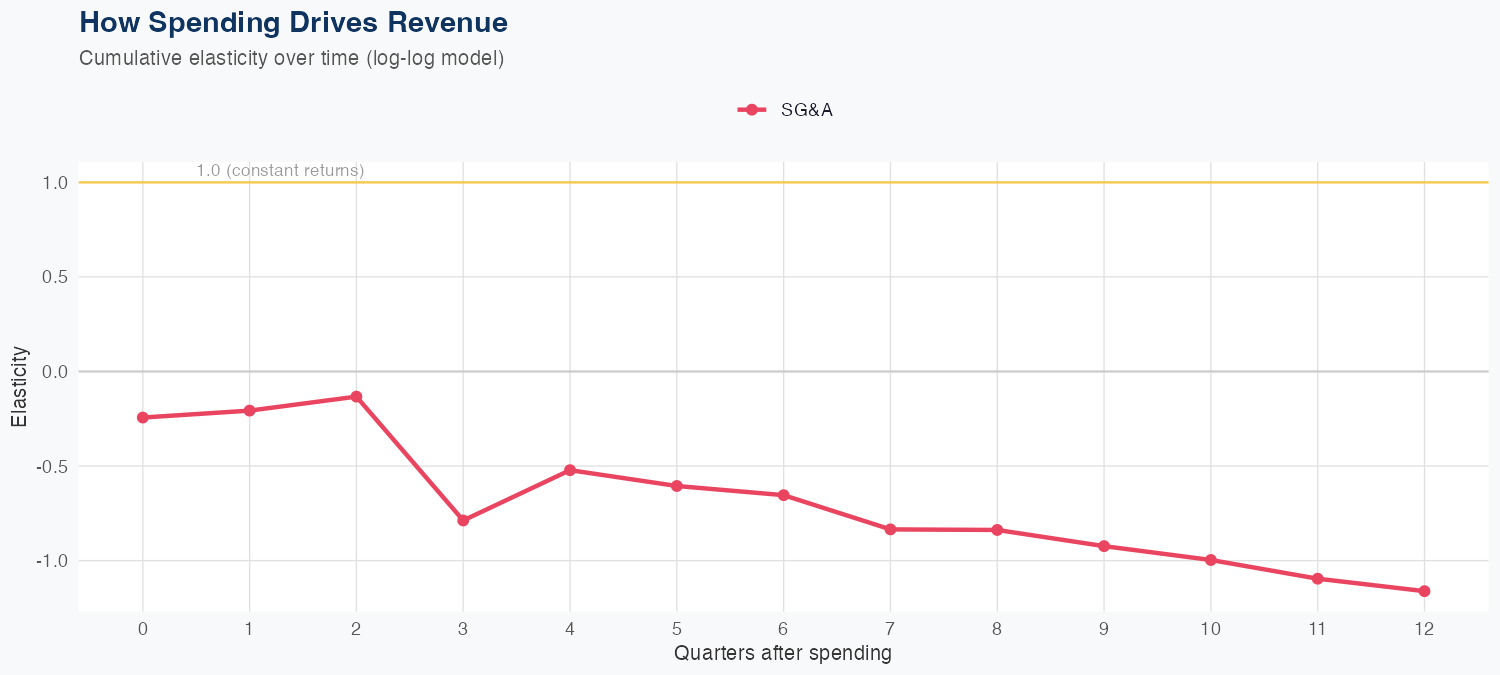
Spending Efficiency Over Time
Current SG&A elasticity: -0.6701x
Want this analysis for your portfolio?
I build custom revenue intelligence reports for investors and companies using SEC filing data, econometric modeling, and AI-powered insights.
Get in Touch