Bank of New York Mellon Corp BK
Revenue Intelligence Report • 70 quarters of SEC filing data • Updated 2026-03-15
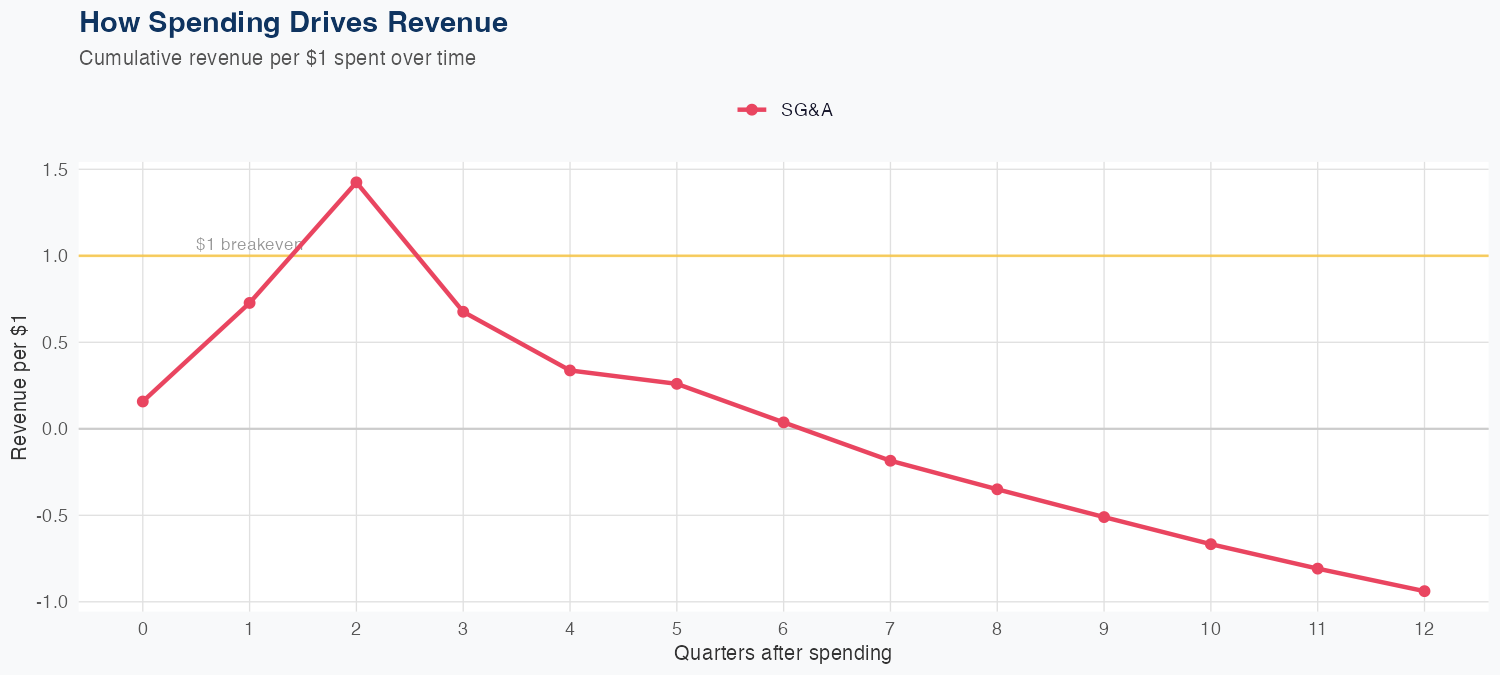
Revenue is forecast to decline about 15% this year to roughly $4.2 billion, as client activity and asset-servicing fees come under pressure. Our econometric model, a long-run linear framework with fixed coefficients across ~70 quarters, links the weakness to softer activity and tighter margins; SG&A spending shows a negative ROI of about -0.94. Forecast reliability is moderate: MAPE around 35.6% and a holdout miss near 15% (predicted ~1.1B vs actual ~1.3B). Key risk: further declines in market activity or ongoing fee pressure could worsen revenue and SG&A inefficiency would curb any margin recovery if volumes stabilize.
Investment Thesis
At 35.6% MAPE, the model captures Bank of New York Mellon Corp's broad revenue trajectory, though quarterly variability suggests sensitivity to external factors.
Revenue Forecast
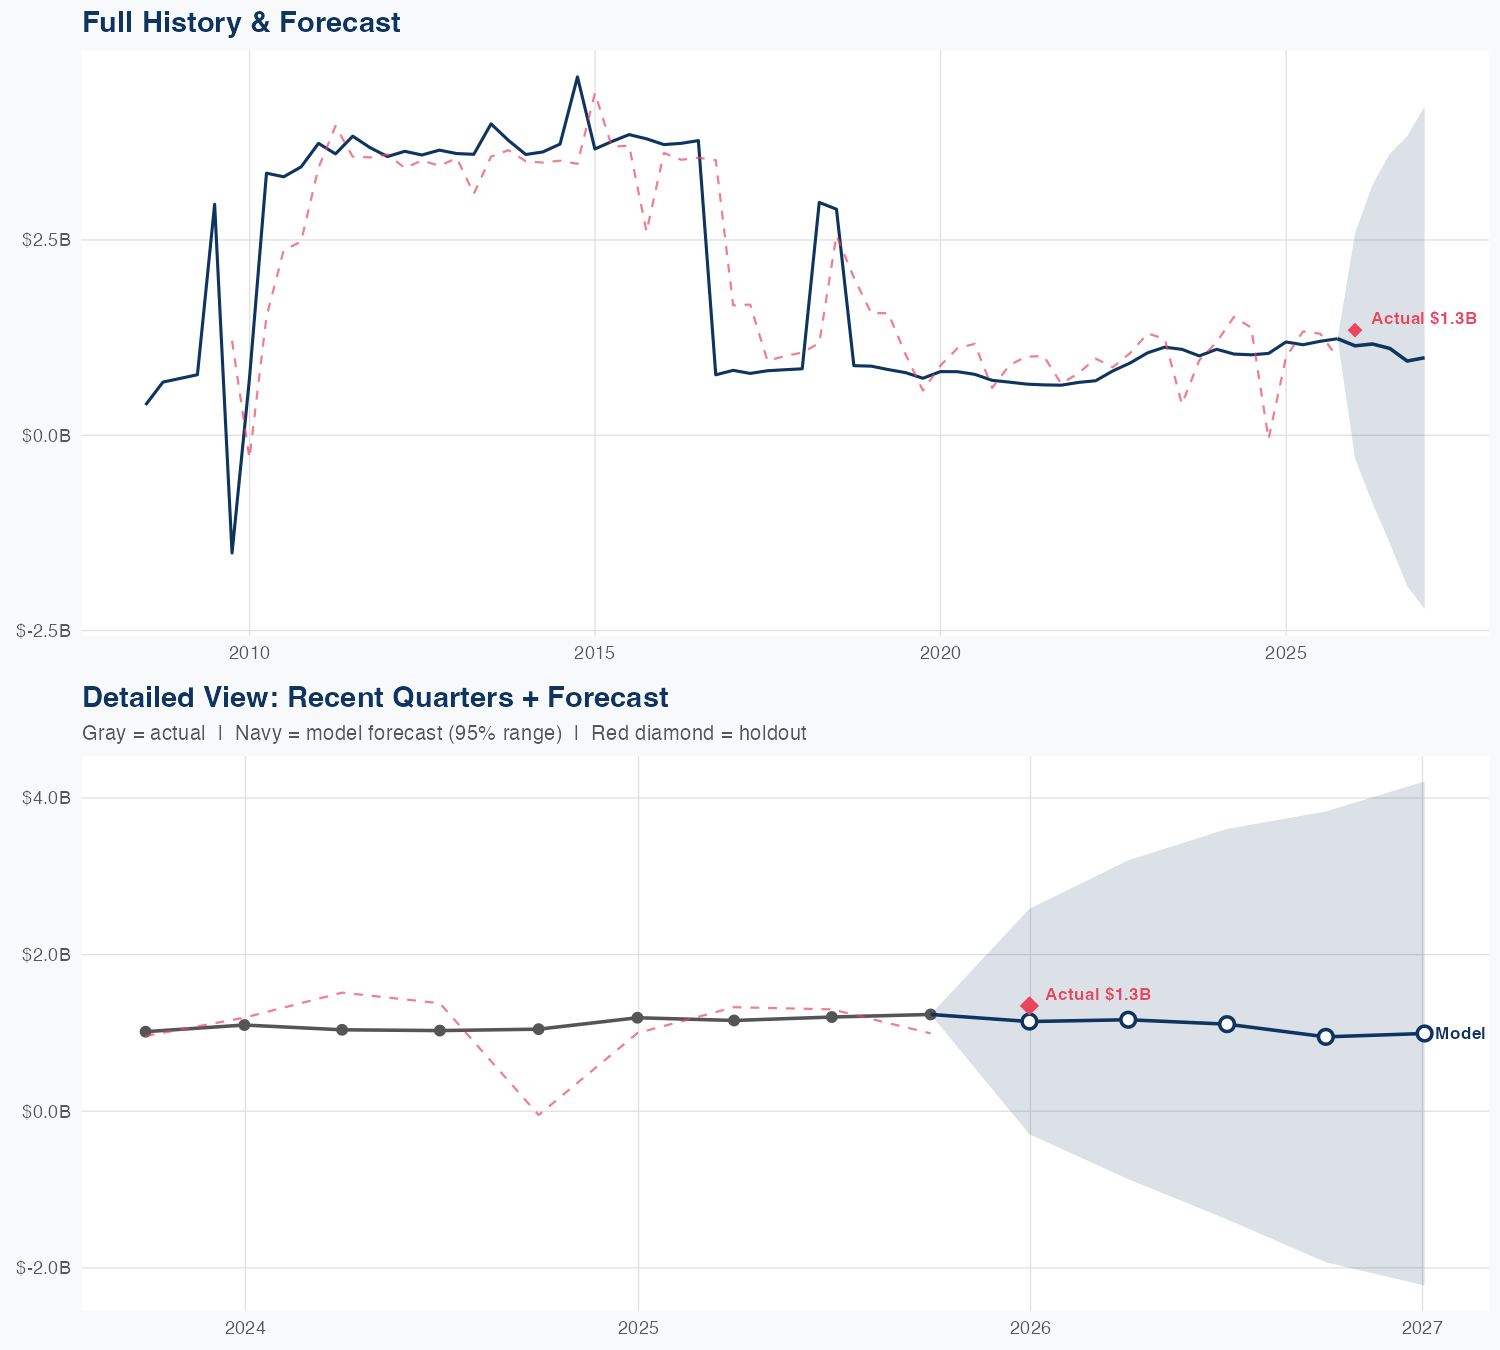
Quarterly Detail
| Quarter | Model Forecast | Actual | 95% Range | YoY Growth | Status |
|---|---|---|---|---|---|
| Q4 2025 | $1.1B | $1.3B | $-0.3B – $2.6B | -4.1% | ✓ In range |
| Q2 2026 | $1.2B | $-0.9B – $3.2B | +0.8% | ||
| Q3 2026 | $1.1B | $-1.4B – $3.6B | -7.6% | ||
| Q4 2026 | $0.9B | $-1.9B – $3.8B | -23.2% | ||
| Q1 2027 | $1.0B | $-2.2B – $4.2B | -26.2% |
Seasonal Factors
| Fiscal Quarter | Seasonal Factor | vs Trend | Interpretation | Obs. |
|---|---|---|---|---|
| FQ1 (Sep–Nov) | 1.0572 | +5.7% | +5.7% above trend | 16 |
| FQ2 (Dec–Feb) | 0.9214 | -7.9% | -7.9% below trend | 16 |
| FQ3 (Mar–May) | 0.914 | -8.6% | -8.6% below trend | 16 |
| FQ4 (Jun–Aug) | 1.0383 | +3.8% | +3.8% above trend | 16 |
How Spending Drives Revenue
Want this analysis for your portfolio?
I build custom revenue intelligence reports for investors and companies using SEC filing data, econometric modeling, and AI-powered insights.
Get in Touch