Berkshire Hathaway Inc BRK.B
Revenue Intelligence Report • 69 quarters of SEC filing data • Updated 2026-03-15
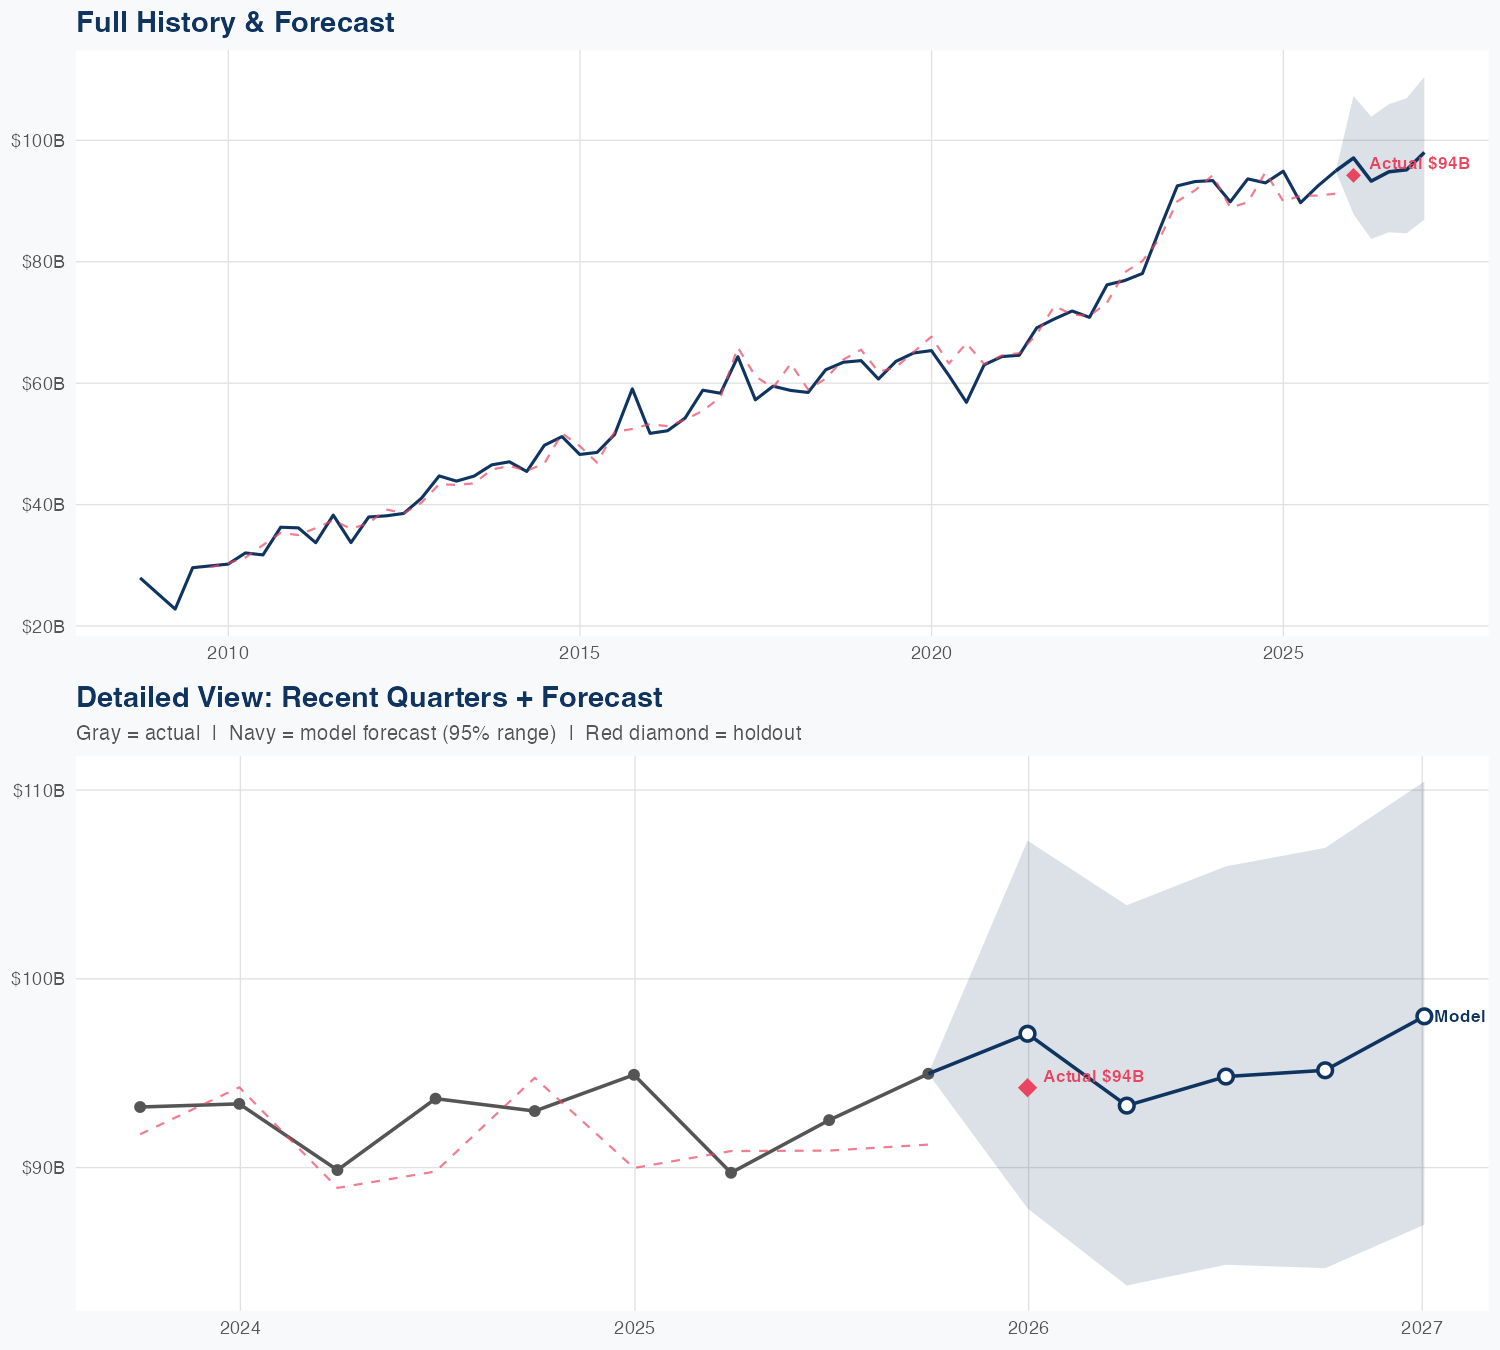
We forecast Berkshire Hathaway’s FY revenue at about $381 billion, up roughly 2.6% year over year, reflecting steady, diversified growth across the portfolio rather than a single growth engine. Our econometric model shows SG&A has a high pass-through to revenue—about 0.97x—so a 1% SG&A uptick lifts revenue roughly 1%, with time-varying estimates showing sensitivity rising toward the mid-0.7x range. Our econometric model uses a log-log specification with 69 quarters of data and time-varying coefficients; forecast accuracy is solid, with a 2.7% MAPE and a -3.0% holdout miss (predicted $97.1B vs $94.2B). Key risk: Berkshire’s results depend on insurance underwriting cycles and investment income volatility; an outsized downturn in markets or worse-than-expected claims could swing actuals away from the forecast.
Investment Thesis
Our ARDL model tracks Berkshire Hathaway Inc's revenue with exceptional precision (2.7% MAPE), indicating highly predictable cash flows. Sales & marketing spend shows a 0.97x elasticity, suggesting effective go-to-market execution.
Revenue Forecast
Quarterly Detail
| Quarter | Model Forecast | Actual | 95% Range | YoY Growth | Status |
|---|---|---|---|---|---|
| Q4 2025 | $97B | $94B | $88B – $107B | +2.3% | ✓ In range |
| Q2 2026 | $93B | $84B – $104B | +4.0% | ||
| Q3 2026 | $95B | $85B – $106B | +2.5% | ||
| Q4 2026 | $95B | $85B – $107B | +0.2% | ||
| Q1 2027 | $98B | $87B – $110B | +4.0% |
Seasonal Factors
| Fiscal Quarter | Seasonal Factor | vs Trend | Interpretation | Obs. |
|---|---|---|---|---|
| FQ1 (Sep–Nov) | 1.0046 | +0.5% | In line with trend | 17 |
| FQ2 (Dec–Feb) | 0.9971 | -0.3% | In line with trend | 17 |
| FQ3 (Mar–May) | 0.9946 | -0.5% | In line with trend | 16 |
| FQ4 (Jun–Aug) | 1.0178 | +1.8% | In line with trend | 16 |
How Spending Drives Revenue
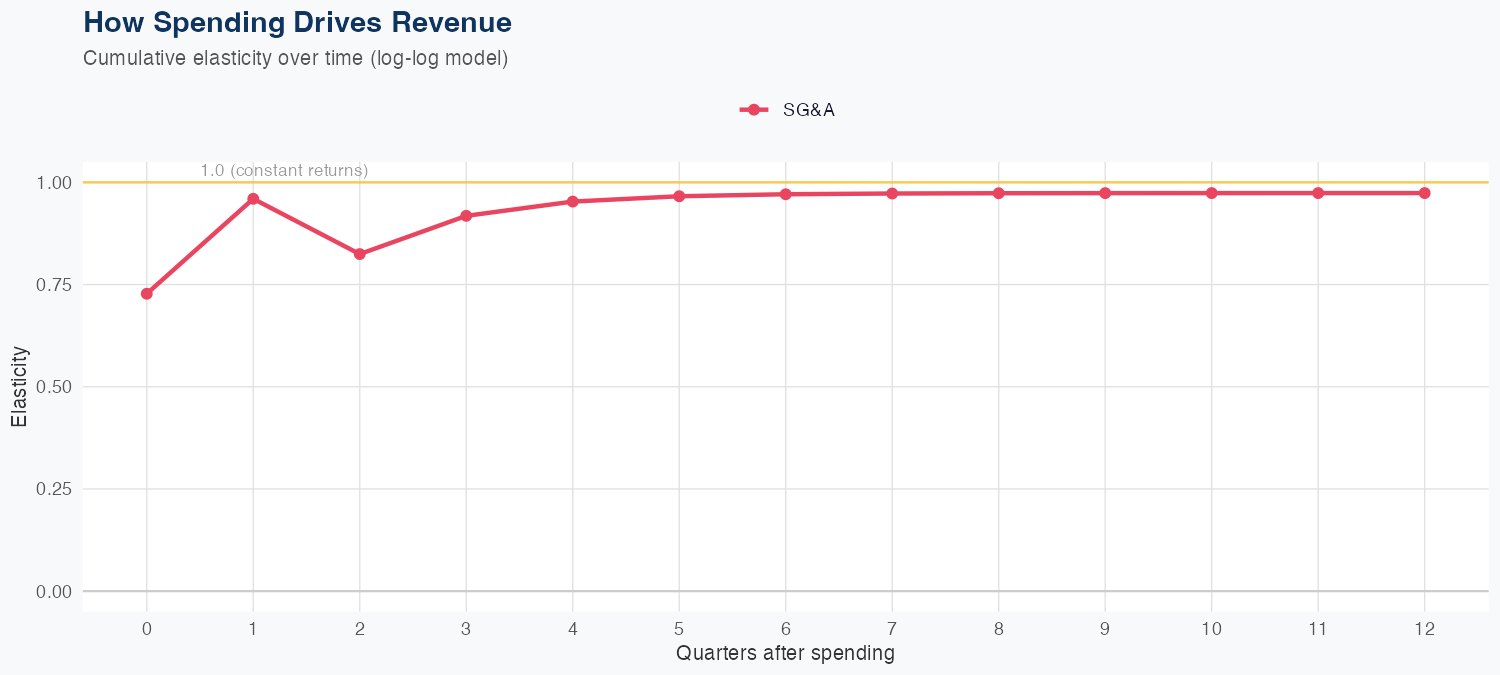
Spending Efficiency Over Time
Current SG&A elasticity: 0.7425x
Want this analysis for your portfolio?
I build custom revenue intelligence reports for investors and companies using SEC filing data, econometric modeling, and AI-powered insights.
Get in Touch