Casey's General Stores, Inc. CASY
Revenue Intelligence Report • 51 quarters of SEC filing data • Updated 2026-03-15
Casey’s revenue is forecast to grow about 16.6% this year, taking revenue toward roughly $23 billion as structural growth and targeted operating investments continue to scale. Our econometric model identifies the binding constraint as SG&A investment capacity—the company’s ability to fund incremental SG&A spend on marketing, store operations, and support functions to drive growth. SG&A elasticity has been high and rising, implying that each additional dollar of SG&A spend yields outsized topline gains and elevates the importance of budget flexibility. Forecast attribution shows structural/platform growth contributing about 15% of the lift, with SG&A spending driving roughly 85% and R&D contribution effectively zero. Key risk: if the company cannot sustain SG&A investment due to budget, cash flow, or capital allocation constraints, the upside from the forecast could be limited.
Investment Thesis
The econometric model achieves strong accuracy (4.3% MAPE), suggesting Casey's General Stores, Inc.'s revenue trajectory is well-characterized by its spending patterns. Sales & marketing spend shows a 1.12x elasticity, suggesting effective go-to-market execution.
Revenue Forecast
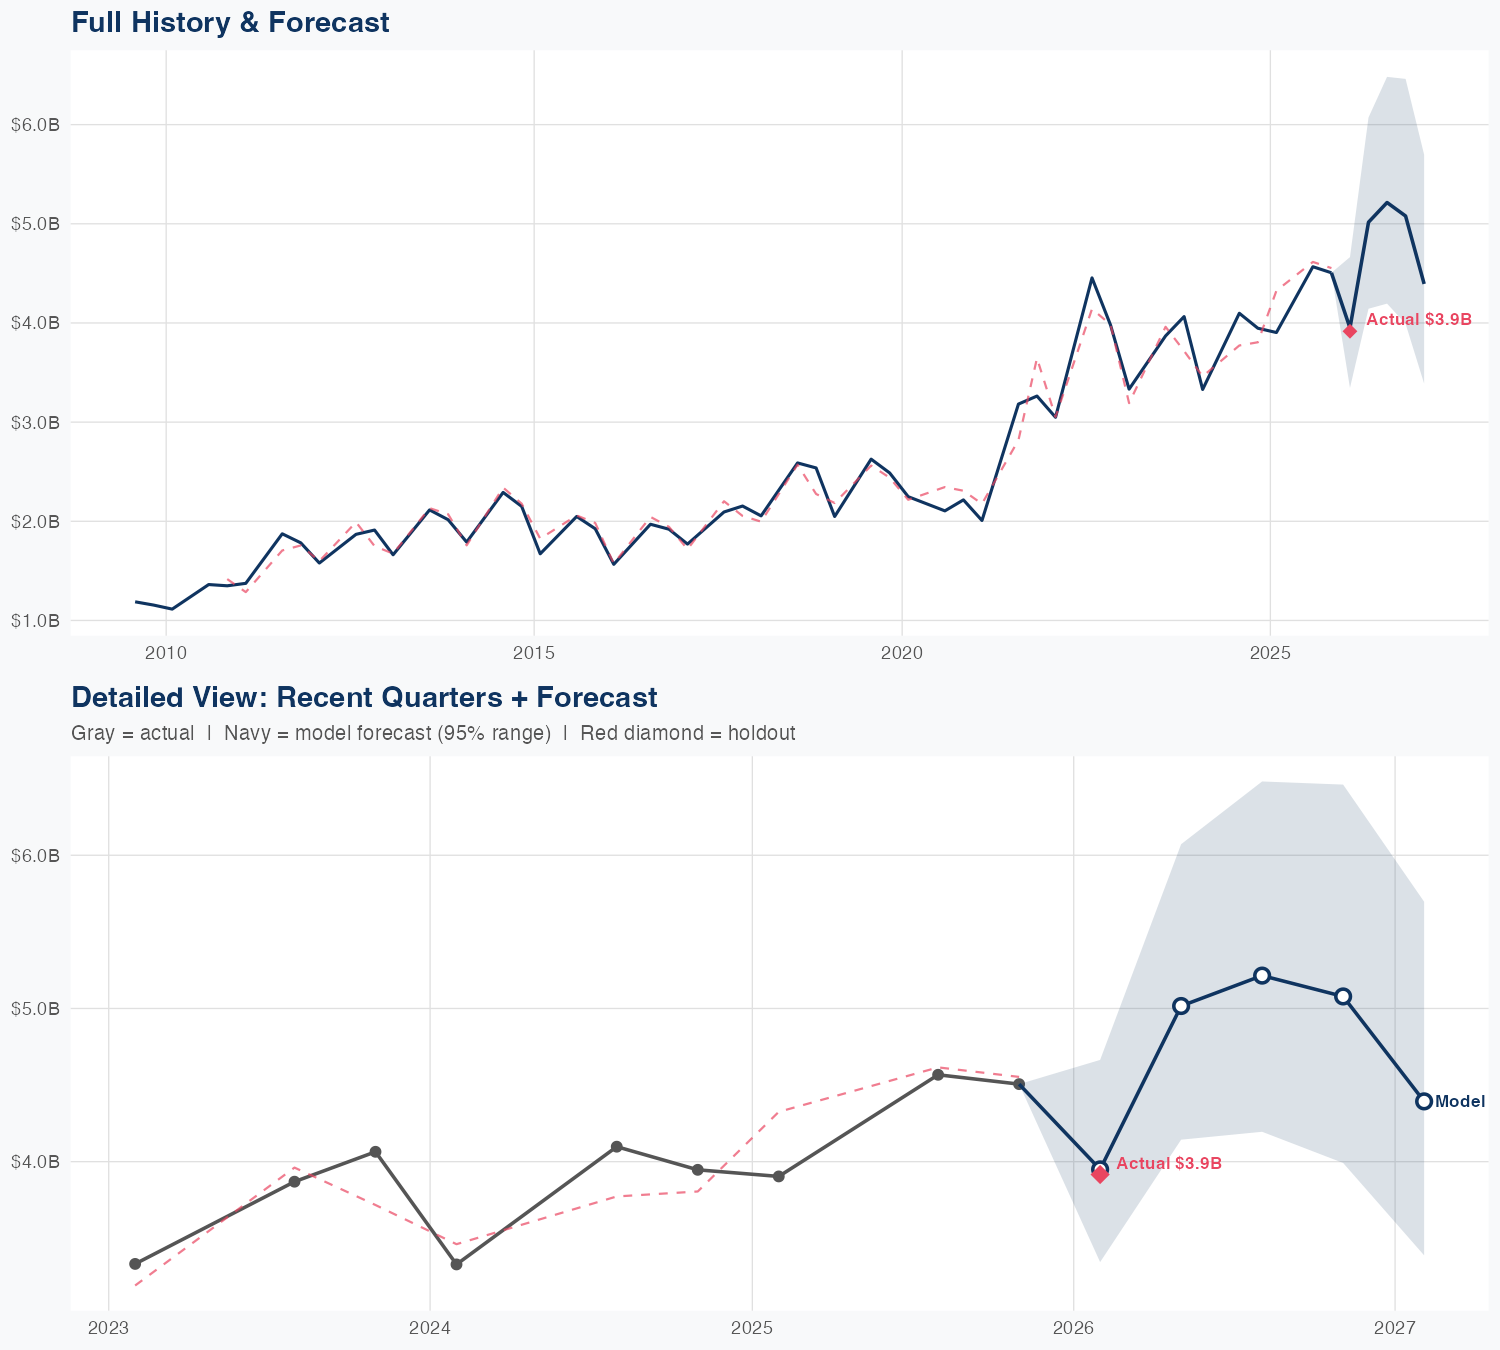
Quarterly Detail
| Quarter | Model Forecast | Actual | 95% Range | YoY Growth | Status |
|---|---|---|---|---|---|
| Q1 2026 | $3.9B | $3.9B | $3.3B – $4.7B | +0.1% | ✓ In range |
| Q2 2026 | $5.0B | $4.1B – $6.1B | +28.5% | ||
| Q3 2026 | $5.2B | $4.2B – $6.5B | +14.2% | ||
| Q4 2026 | $5.1B | $4.0B – $6.5B | +12.7% | ||
| Q1 2027 | $4.4B | $3.4B – $5.7B | +12.2% |
Seasonal Factors
| Fiscal Quarter | Seasonal Factor | vs Trend | Interpretation | Obs. |
|---|---|---|---|---|
| FQ1 (Sep–Nov) | 0.9988 | -0.1% | In line with trend | 16 |
| FQ2 (Dec–Feb) | 0.9991 | -0.1% | In line with trend | 16 |
| FQ3 (Mar–May) | 1.0 | +0.0% | In line with trend | 0 |
| FQ4 (Jun–Aug) | 0.9916 | -0.8% | In line with trend | 15 |
How Spending Drives Revenue
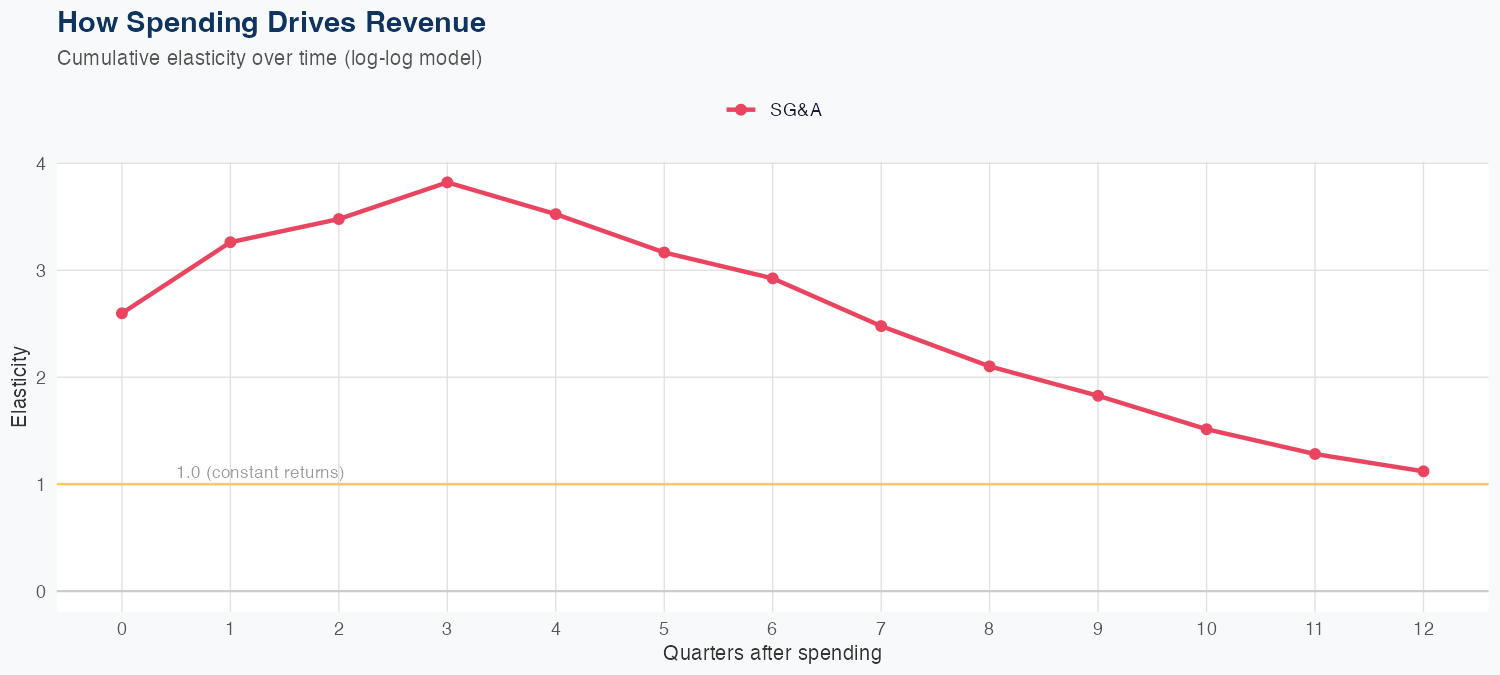
Spending Efficiency Over Time
Current SG&A elasticity: 2.9973x
Want this analysis for your portfolio?
I build custom revenue intelligence reports for investors and companies using SEC filing data, econometric modeling, and AI-powered insights.
Get in Touch