Chubb Limited CB
Revenue Intelligence Report • 70 quarters of SEC filing data • Updated 2026-03-15
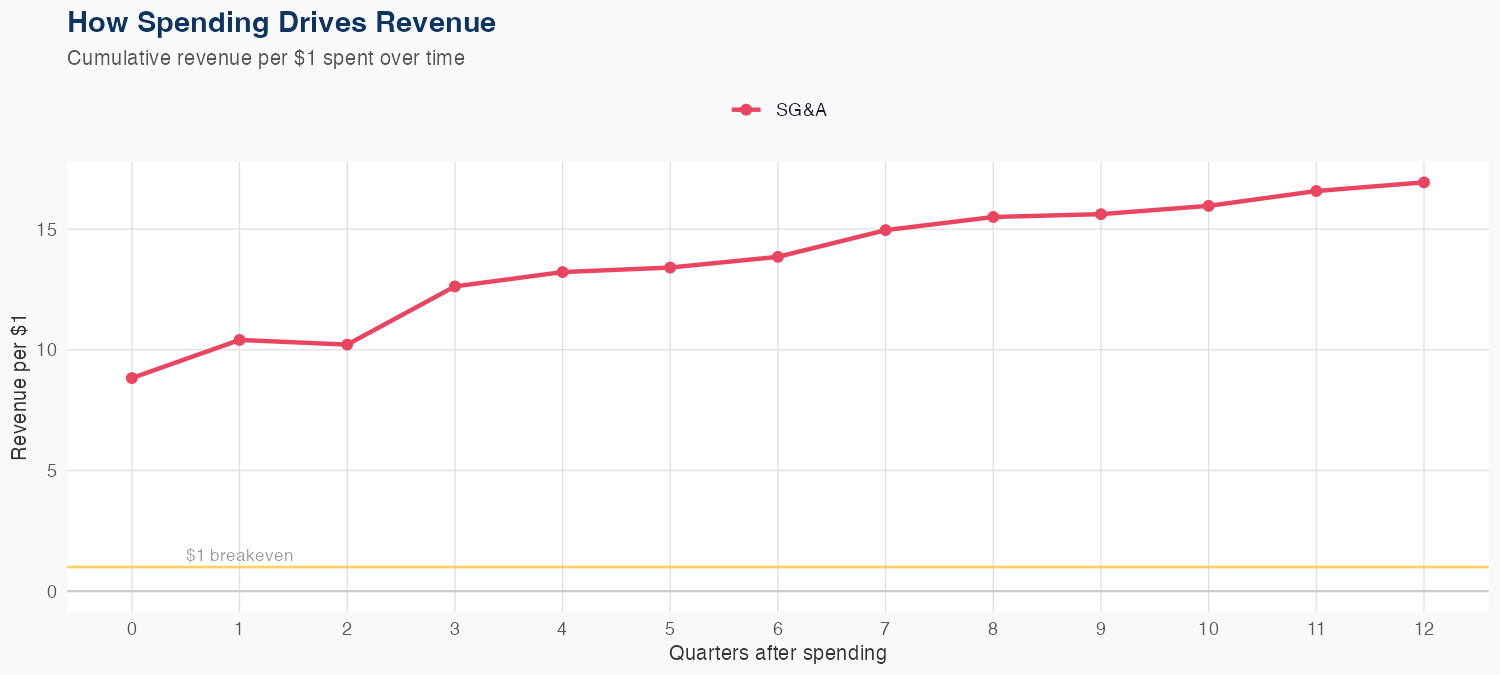
Revenue growth is driven by scalable SG&A effectiveness, with each $1 of SG&A spending translating into about $16.94 of long-run revenue. The model is linear with a 4.8% MAPE, and a holdout test predicted $15.0B versus $15.0B actual, a -1.9% error, underscoring the reliability of the revenue pull-through estimate. The latest quarterly revenue stands at about $15.07B, illustrating scale in the current period. The FY forecast projects roughly $64B in revenue, up about 8.1% year over year, signaling a healthy growth trajectory supported by strong SG&A-driven revenue leverage.
Investment Thesis
The econometric model achieves strong accuracy (4.8% MAPE), suggesting Chubb Limited's revenue trajectory is well-characterized by its spending patterns. Each $1 of SG&A spending generates $16.94 in revenue, reflecting strong commercial efficiency.
Revenue Forecast
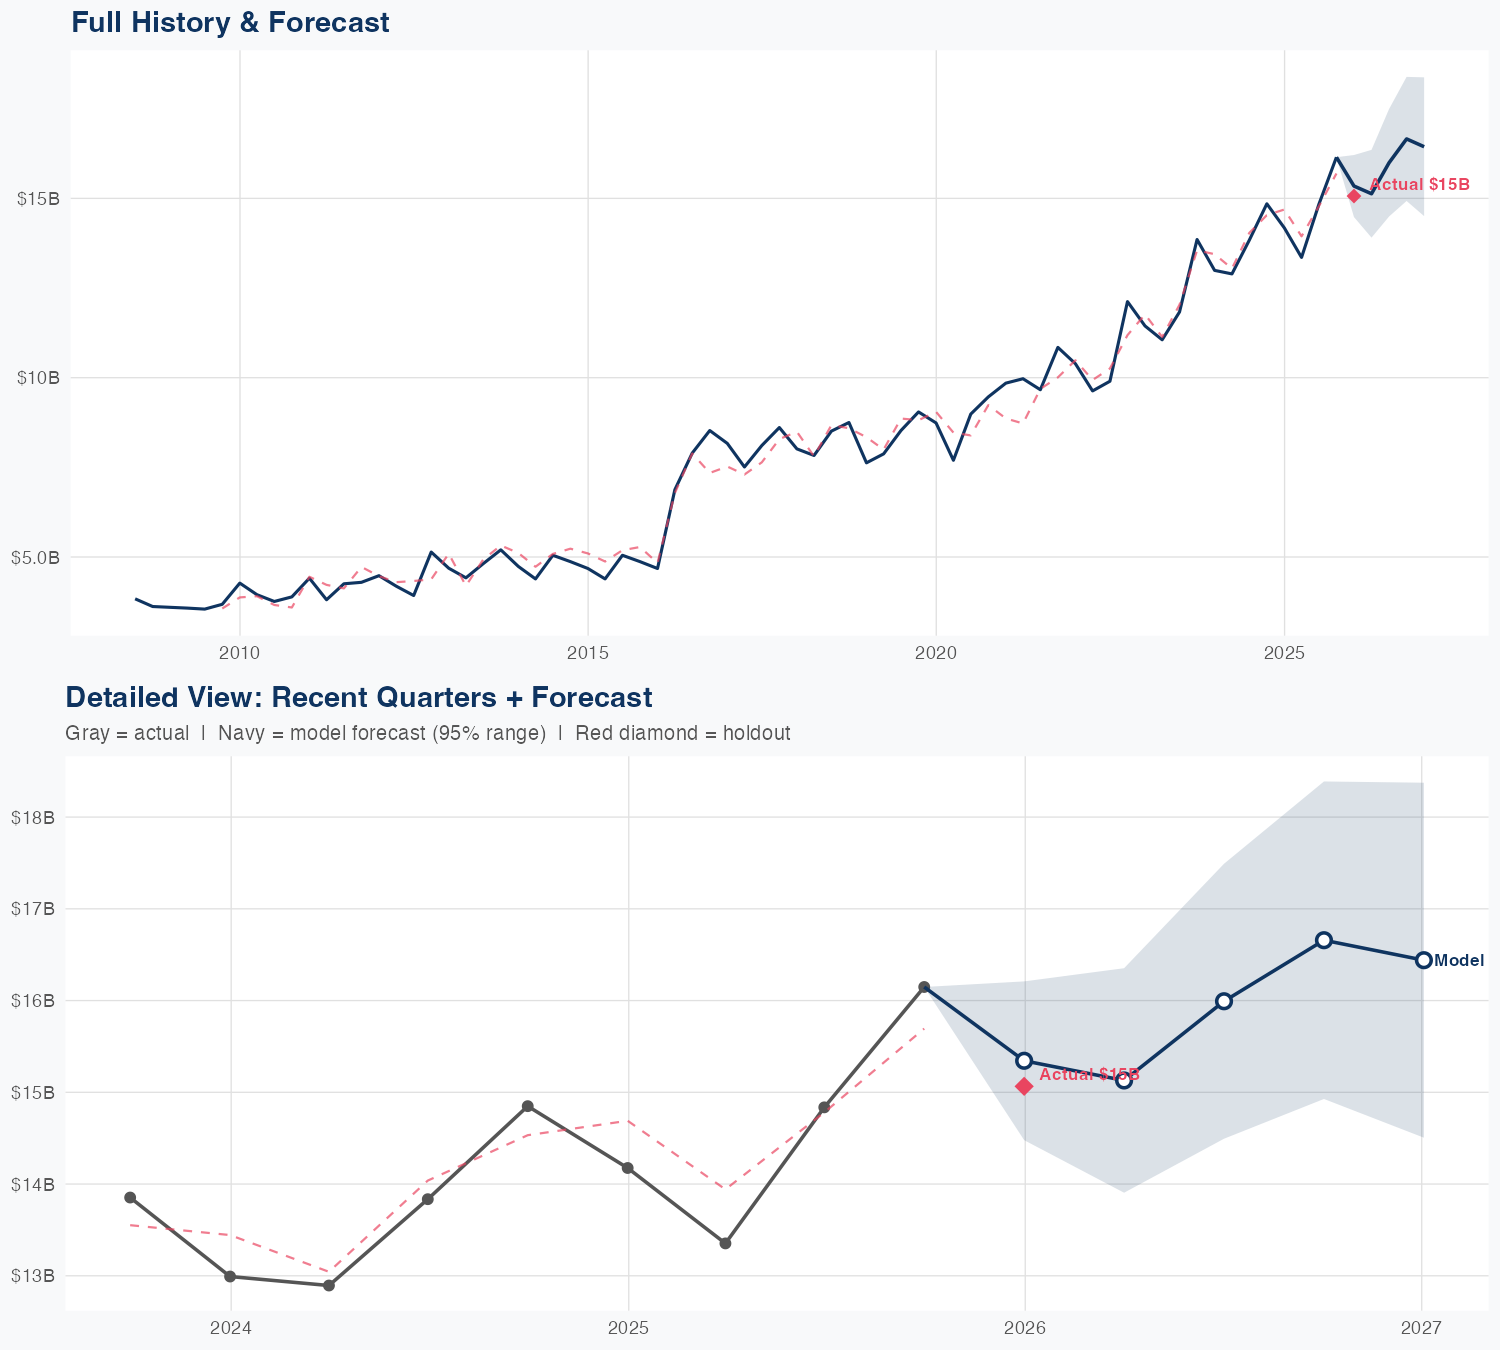
Quarterly Detail
| Quarter | Model Forecast | Actual | 95% Range | YoY Growth | Status |
|---|---|---|---|---|---|
| Q4 2025 | $15B | $15B | $14B – $16B | +8.2% | ✓ In range |
| Q2 2026 | $15B | $14B – $16B | +13.3% | ||
| Q3 2026 | $16B | $14B – $17B | +7.8% | ||
| Q4 2026 | $17B | $15B – $18B | +3.2% | ||
| Q1 2027 | $16B | $15B – $18B | +9.1% |
Seasonal Factors
| Fiscal Quarter | Seasonal Factor | vs Trend | Interpretation | Obs. |
|---|---|---|---|---|
| FQ1 (Sep–Nov) | 1.0261 | +2.6% | In line with trend | 17 |
| FQ2 (Dec–Feb) | 0.968 | -3.2% | -3.2% below trend | 17 |
| FQ3 (Mar–May) | 0.9885 | -1.1% | In line with trend | 16 |
| FQ4 (Jun–Aug) | 0.9926 | -0.7% | In line with trend | 16 |
How Spending Drives Revenue
Want this analysis for your portfolio?
I build custom revenue intelligence reports for investors and companies using SEC filing data, econometric modeling, and AI-powered insights.
Get in Touch