Citizens Financial Group Inc/Ri CFG
Revenue Intelligence Report • 49 quarters of SEC filing data • Updated 2026-03-15
Revenue is forecast to fall about 4% year over year, as macro headwinds weigh on loan demand while CFG continues to leverage platform scale and recurring revenue to cushion the decline. Binding constraint: our econometric model shows elasticities at the margin are low and structural growth remains the engine, implying the binding constraint is loan origination capacity and balance-sheet deployment to convert platform growth into realized revenue. SG&A elasticity is about 0.8x, and the time-varying analysis shows rising operating leverage, with structural/platform growth contributing roughly 70% of revenue change; MAPE is 2.4% and the holdout miss was +4%. Key risk: a sharper-than-expected drop in loan demand or tighter funding costs could cap CFG’s revenue growth despite platform advantages.
Investment Thesis
Our ARDL model tracks Citizens Financial Group Inc/Ri's revenue with exceptional precision (2.4% MAPE), indicating highly predictable cash flows. Sales & marketing spend shows a 0.80x elasticity, suggesting effective go-to-market execution.
Revenue Forecast
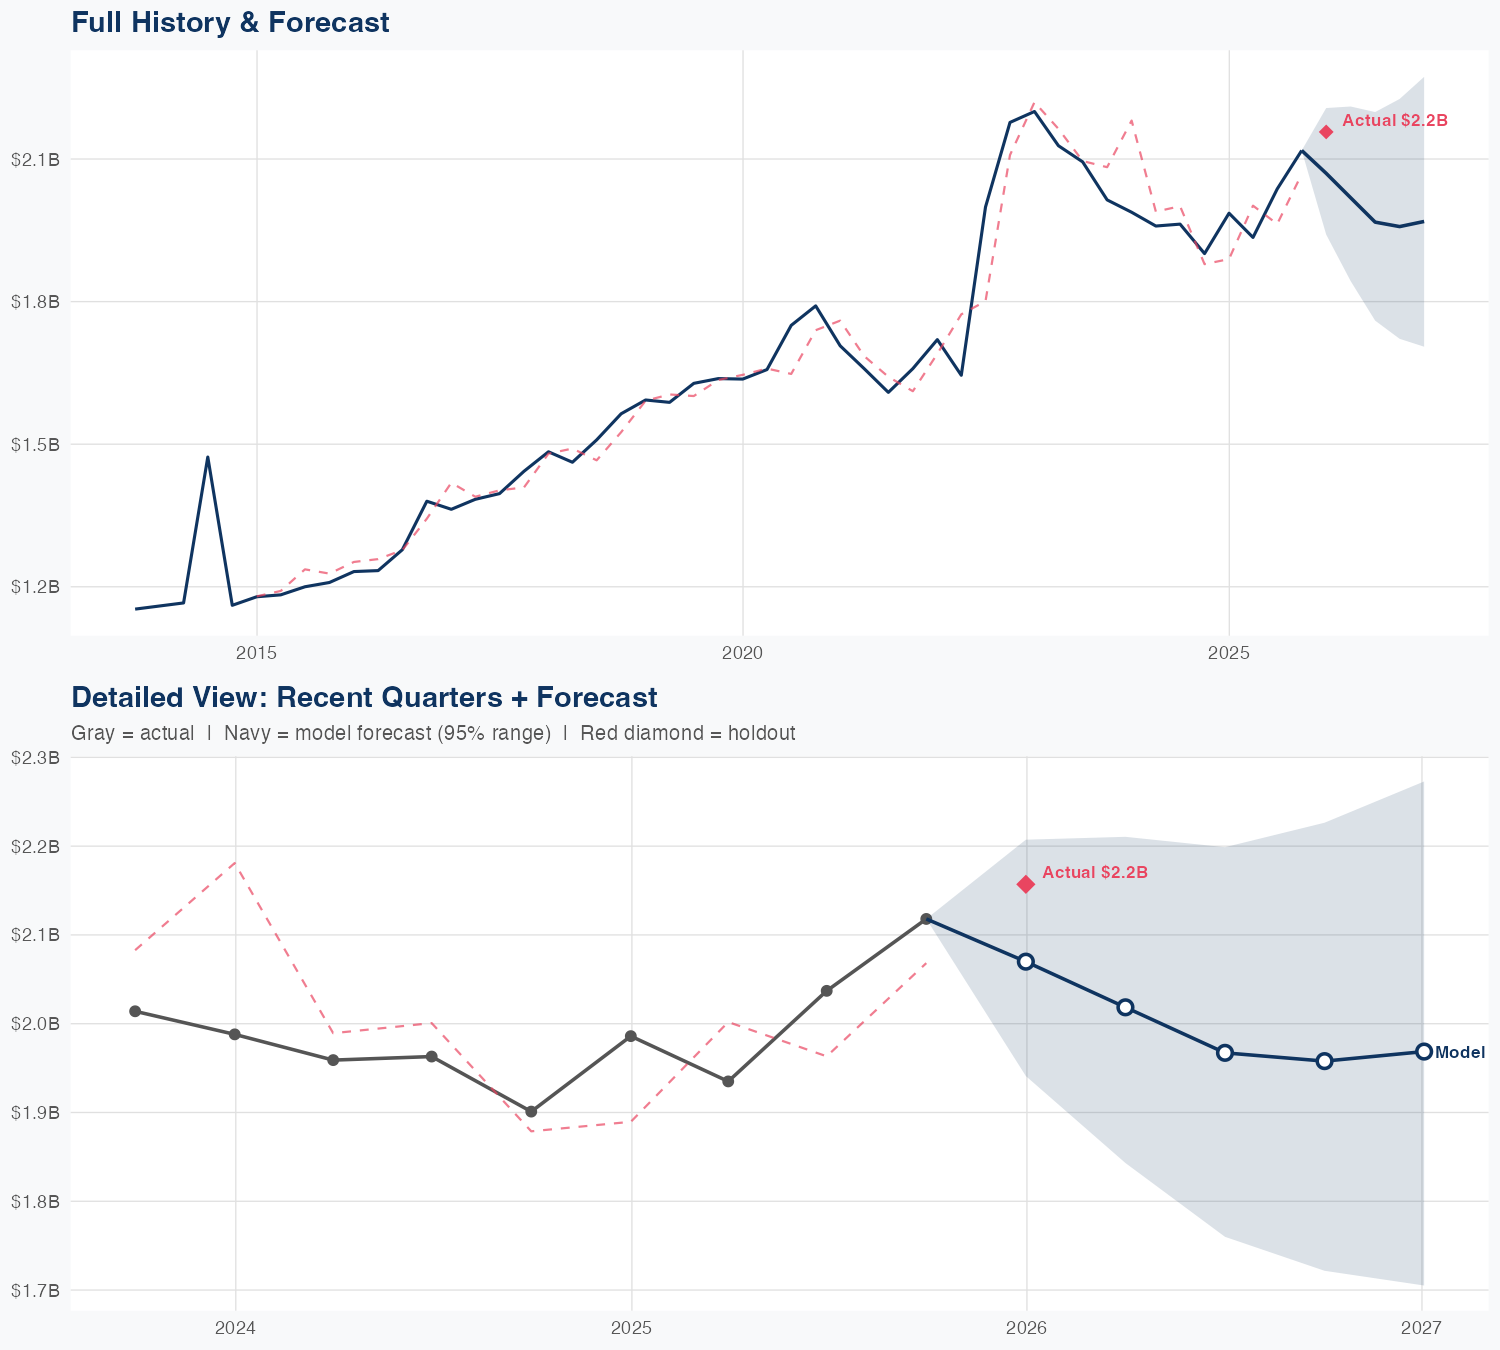
Quarterly Detail
| Quarter | Model Forecast | Actual | 95% Range | YoY Growth | Status |
|---|---|---|---|---|---|
| Q4 2025 | $2.1B | $2.2B | $1.9B – $2.2B | +4.2% | ✓ In range |
| Q2 2026 | $2.0B | $1.8B – $2.2B | +4.3% | ||
| Q3 2026 | $2.0B | $1.8B – $2.2B | -3.4% | ||
| Q4 2026 | $2.0B | $1.7B – $2.2B | -7.6% | ||
| Q1 2027 | $2.0B | $1.7B – $2.3B | -8.7% |
Seasonal Factors
| Fiscal Quarter | Seasonal Factor | vs Trend | Interpretation | Obs. |
|---|---|---|---|---|
| FQ1 (Sep–Nov) | 1.0241 | +2.4% | In line with trend | 11 |
| FQ2 (Dec–Feb) | 0.9992 | -0.1% | In line with trend | 12 |
| FQ3 (Mar–May) | 0.9843 | -1.6% | In line with trend | 11 |
| FQ4 (Jun–Aug) | 1.0006 | +0.1% | In line with trend | 11 |
How Spending Drives Revenue
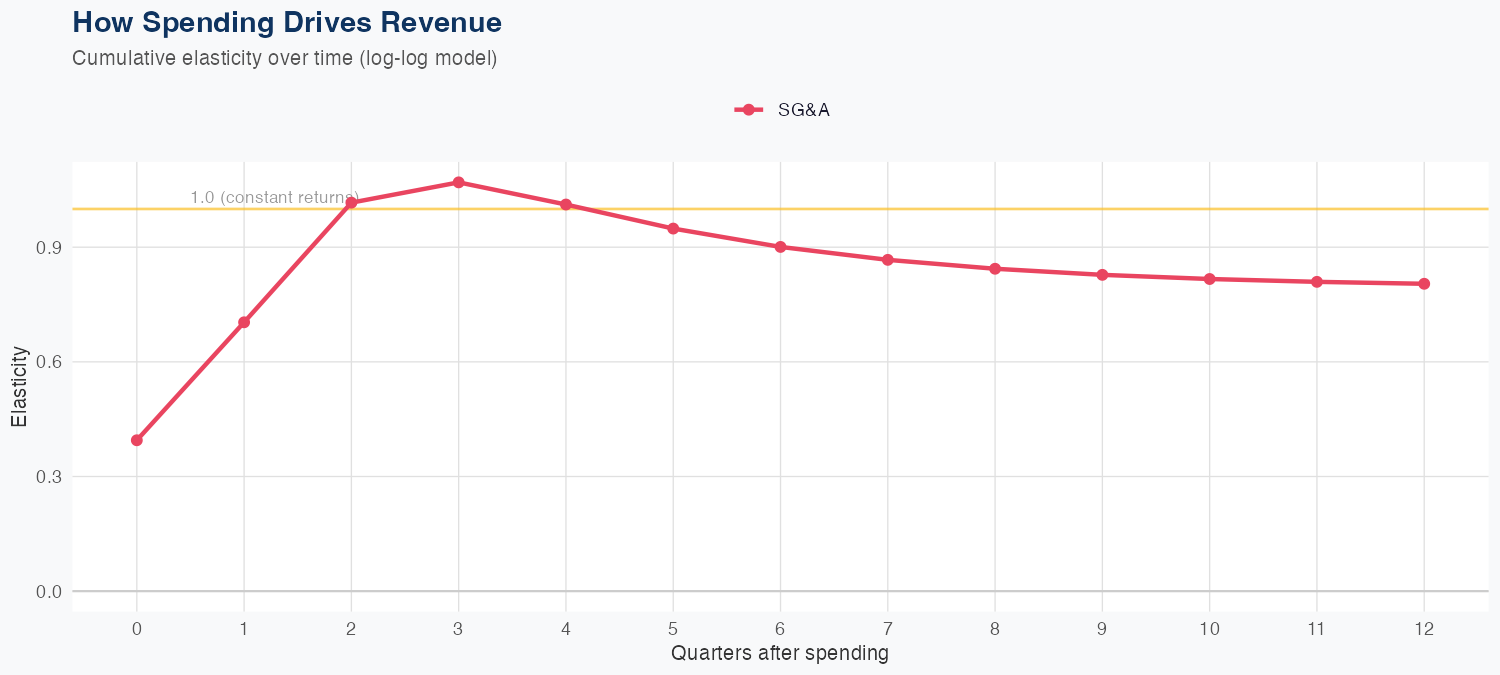
Spending Efficiency Over Time
Current SG&A elasticity: 0.2218x
Want this analysis for your portfolio?
I build custom revenue intelligence reports for investors and companies using SEC filing data, econometric modeling, and AI-powered insights.
Get in Touch