Cme Group Inc. CME
Revenue Intelligence Report • 70 quarters of SEC filing data • Updated 2026-03-15
CME Group's revenue is expected to grow about 6% year over year to roughly $7.3 billion, driven by platform scale and pricing power rather than incremental SG&A spend. The binding constraint on revenue growth appears to be platform capacity—trading and clearing throughput—as our econometric model shows structural growth accounting for about 93% of the rise while SG&A contributes roughly 7%. The time-varying SG&A multiplier has fallen from about 1.12 to -0.04 over the period, indicating rising operating leverage and that CME can generate more revenue without a proportional increase in spend. Key risk: a surge in volumes beyond system capacity could throttle growth, making trading and clearing capacity the critical constraint to monitor.
Investment Thesis
The econometric model achieves strong accuracy (5.8% MAPE), suggesting Cme Group Inc.'s revenue trajectory is well-characterized by its spending patterns. Each $1 of SG&A spending generates $2.53 in revenue, reflecting strong commercial efficiency.
Revenue Forecast
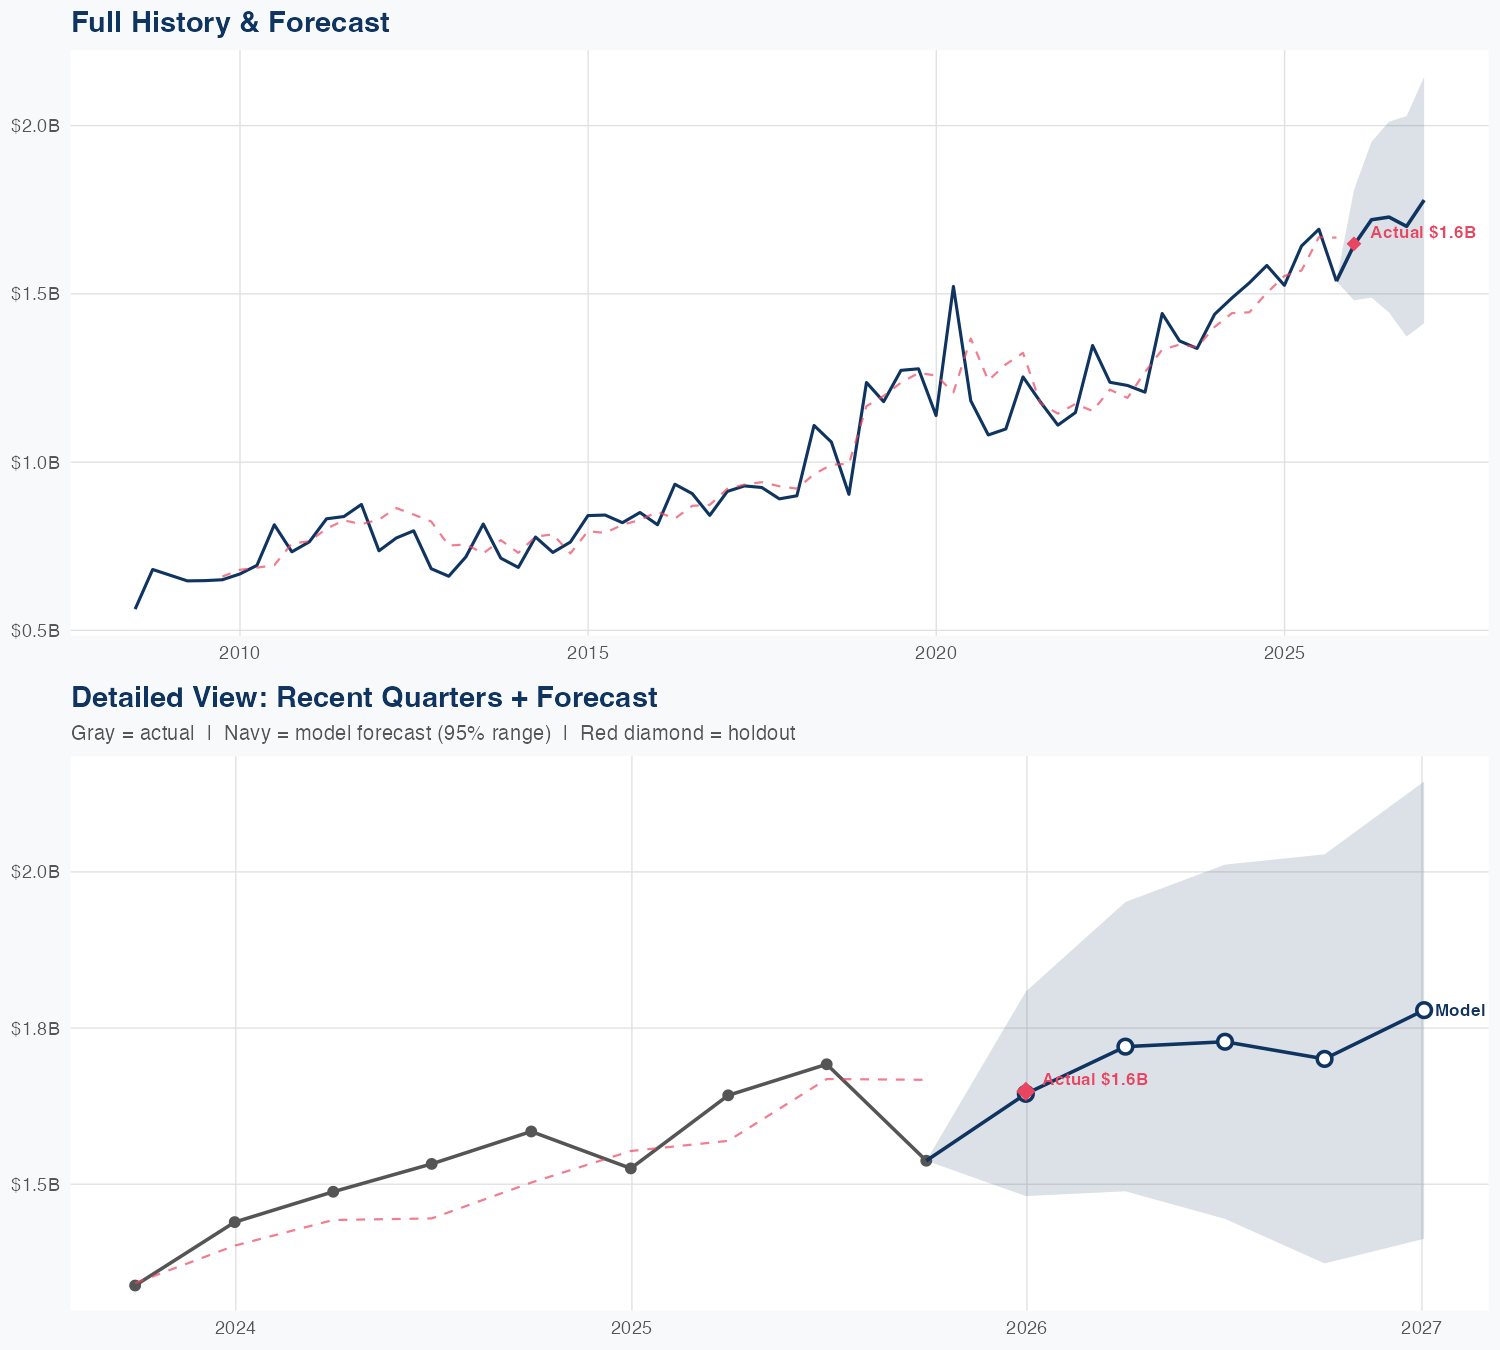
Quarterly Detail
| Quarter | Model Forecast | Actual | 95% Range | YoY Growth | Status |
|---|---|---|---|---|---|
| Q4 2025 | $1.6B | $1.6B | $1.5B – $1.8B | +7.8% | ✓ In range |
| Q2 2026 | $1.7B | $1.5B – $2.0B | +4.7% | ||
| Q3 2026 | $1.7B | $1.4B – $2.0B | +2.1% | ||
| Q4 2026 | $1.7B | $1.4B – $2.0B | +10.6% | ||
| Q1 2027 | $1.8B | $1.4B – $2.1B | +7.9% |
Seasonal Factors
| Fiscal Quarter | Seasonal Factor | vs Trend | Interpretation | Obs. |
|---|---|---|---|---|
| FQ1 (Sep–Nov) | 0.9702 | -3.0% | In line with trend | 17 |
| FQ2 (Dec–Feb) | 0.9781 | -2.2% | In line with trend | 17 |
| FQ3 (Mar–May) | 1.0365 | +3.6% | +3.6% above trend | 16 |
| FQ4 (Jun–Aug) | 1.0141 | +1.4% | In line with trend | 16 |
How Spending Drives Revenue
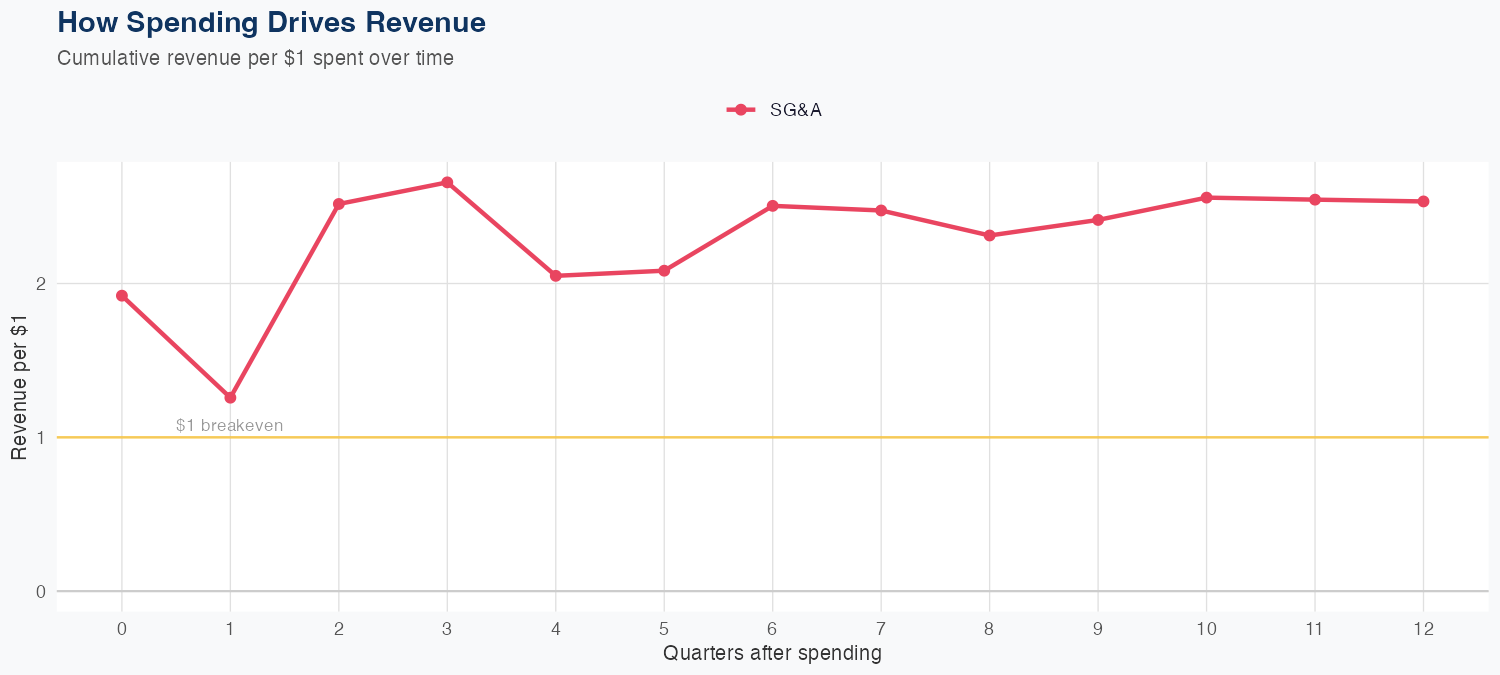
Spending Efficiency Over Time
Current SG&A multiplier: -0.0426
Want this analysis for your portfolio?
I build custom revenue intelligence reports for investors and companies using SEC filing data, econometric modeling, and AI-powered insights.
Get in Touch