Centerpoint Energy, inc. CNP
Revenue Intelligence Report • 24 quarters of SEC filing data • Updated 2026-03-15
Revenue is forecast to grow about 14% year over year to roughly $11.5 billion, with the uplift broad-based across its service territory. Our econometric model attributes roughly 3% of that growth to structural/platform expansion and about 97% to SG&A-driven topline lift, with SG&A delivering about $1.09 of revenue per $1 spent. Time-varying analysis shows the SG&A multiplier rising from about 0.88 to 0.93, indicating incremental SG&A spend now translates into more topline growth than before. Binding constraint: the key constraint on upside is regulatory in nature—the pace and outcome of rate cases to allow higher tariffs and cost recovery for SG&A investments. Key risk: regulatory delays or adverse rate-case outcomes could cap revenue growth and delay the payback on capital and SG&A investments.
Investment Thesis
Our ARDL model tracks Centerpoint Energy, inc.'s revenue with exceptional precision (2.2% MAPE), indicating highly predictable cash flows. Each $1 of SG&A spending generates $1.09 in revenue, reflecting strong commercial efficiency.
Revenue Forecast
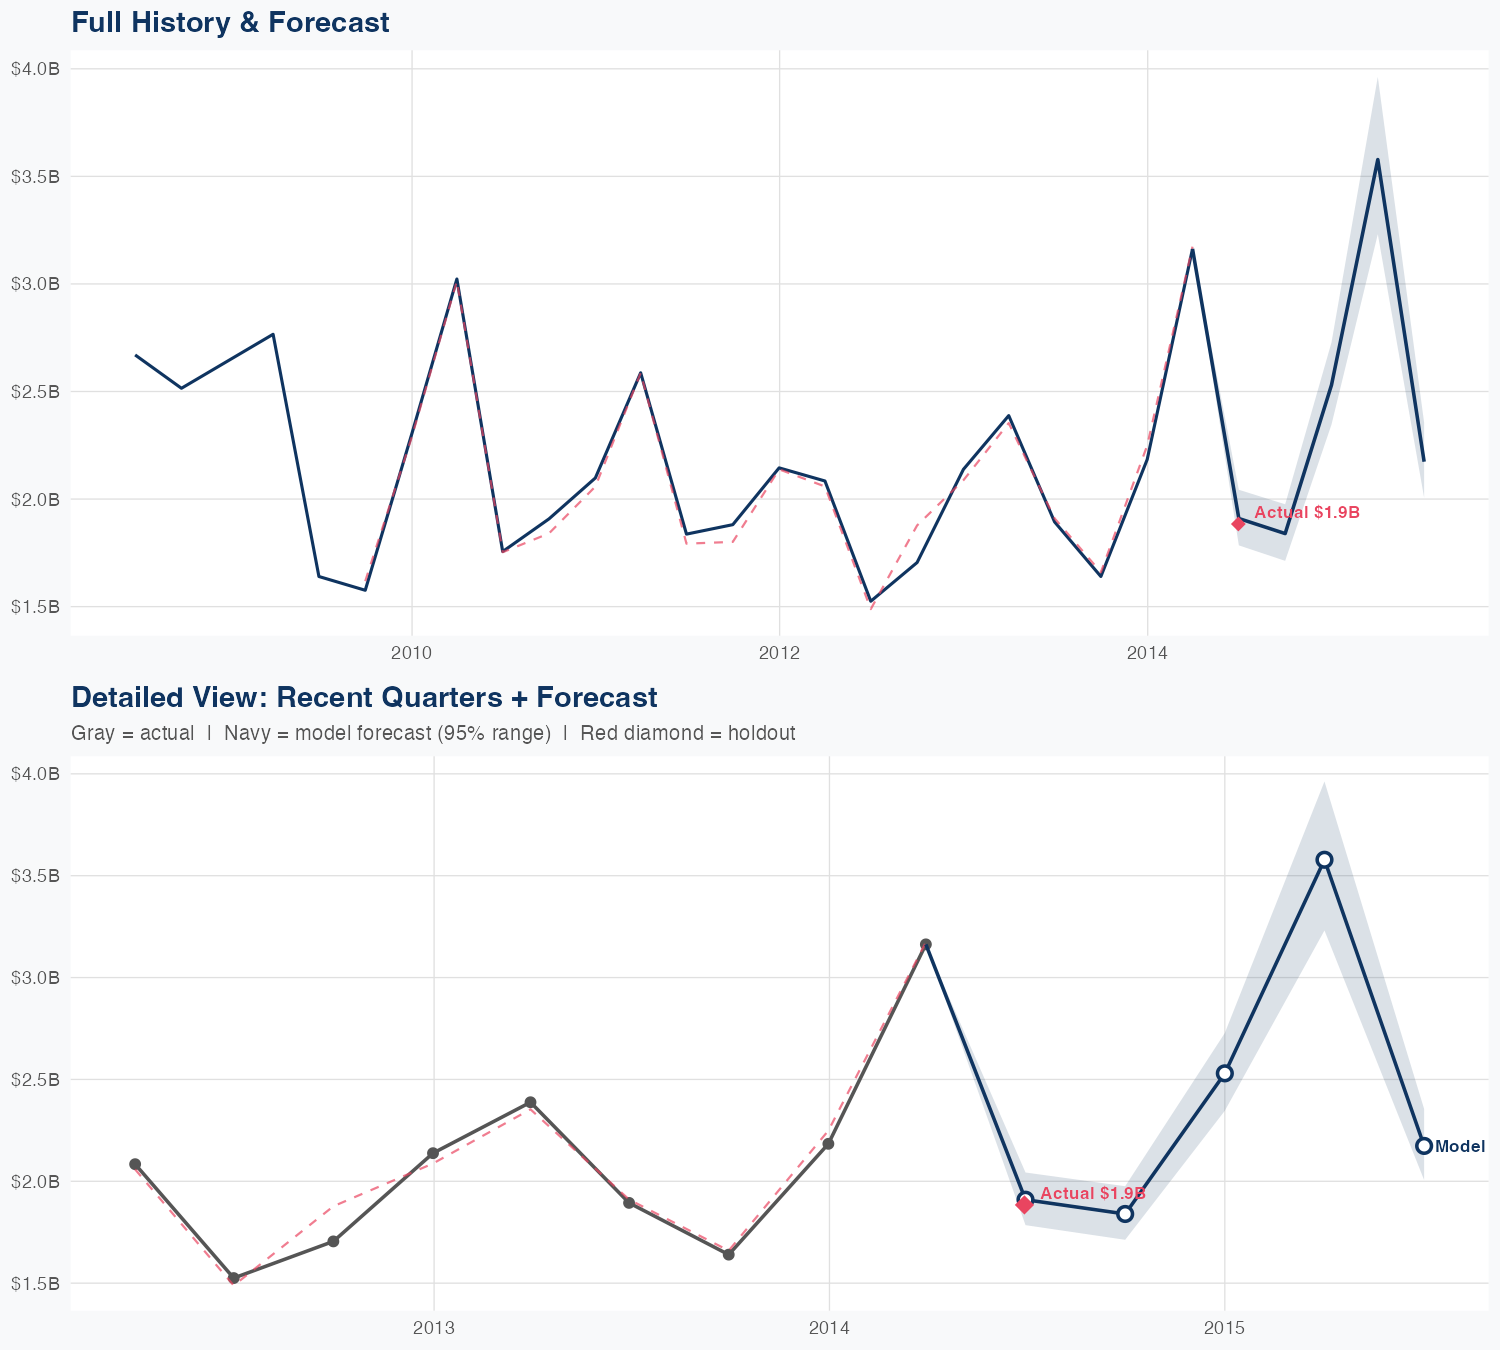
Quarterly Detail
| Quarter | Model Forecast | Actual | 95% Range | YoY Growth | Status |
|---|---|---|---|---|---|
| Q3 2014 | $1.9B | $1.9B | $1.8B – $2.0B | +0.8% | ✓ In range |
| Q4 2014 | $1.8B | $1.7B – $2.0B | +12.2% | ||
| Q1 2015 | $2.5B | $2.3B – $2.7B | +15.8% | ||
| Q2 2015 | $3.6B | $3.2B – $4.0B | +13.1% | ||
| Q3 2015 | $2.2B | $2.0B – $2.4B | +15.4% |
Seasonal Factors
| Fiscal Quarter | Seasonal Factor | vs Trend | Interpretation | Obs. |
|---|---|---|---|---|
| FQ1 (Sep–Nov) | 0.9882 | -1.2% | In line with trend | 5 |
| FQ2 (Dec–Feb) | 1.0063 | +0.6% | In line with trend | 5 |
| FQ3 (Mar–May) | 1.0031 | +0.3% | In line with trend | 5 |
| FQ4 (Jun–Aug) | 1.0018 | +0.2% | In line with trend | 5 |
How Spending Drives Revenue
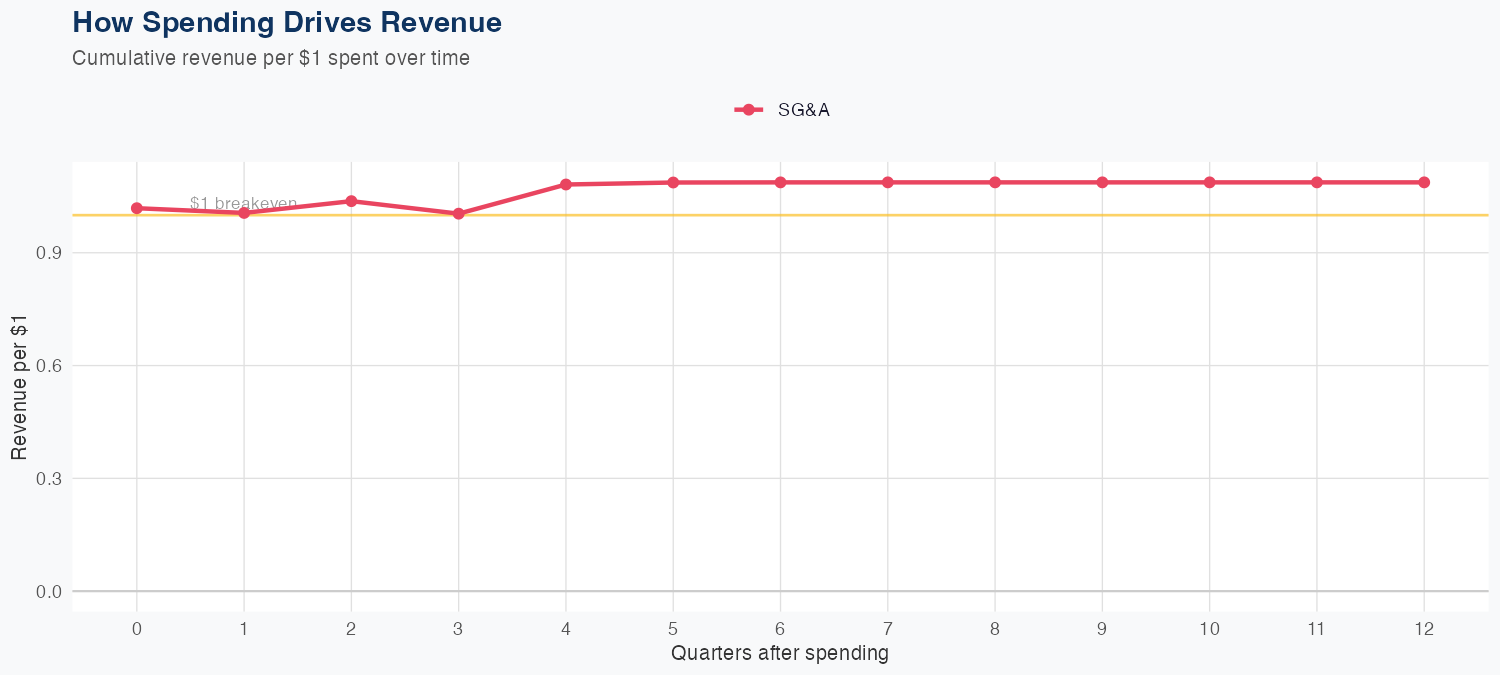
Spending Efficiency Over Time
Current SG&A multiplier: 0.9334
Want this analysis for your portfolio?
I build custom revenue intelligence reports for investors and companies using SEC filing data, econometric modeling, and AI-powered insights.
Get in Touch