Capital one financial corp COF
Revenue Intelligence Report • 70 quarters of SEC filing data • Updated 2026-03-15
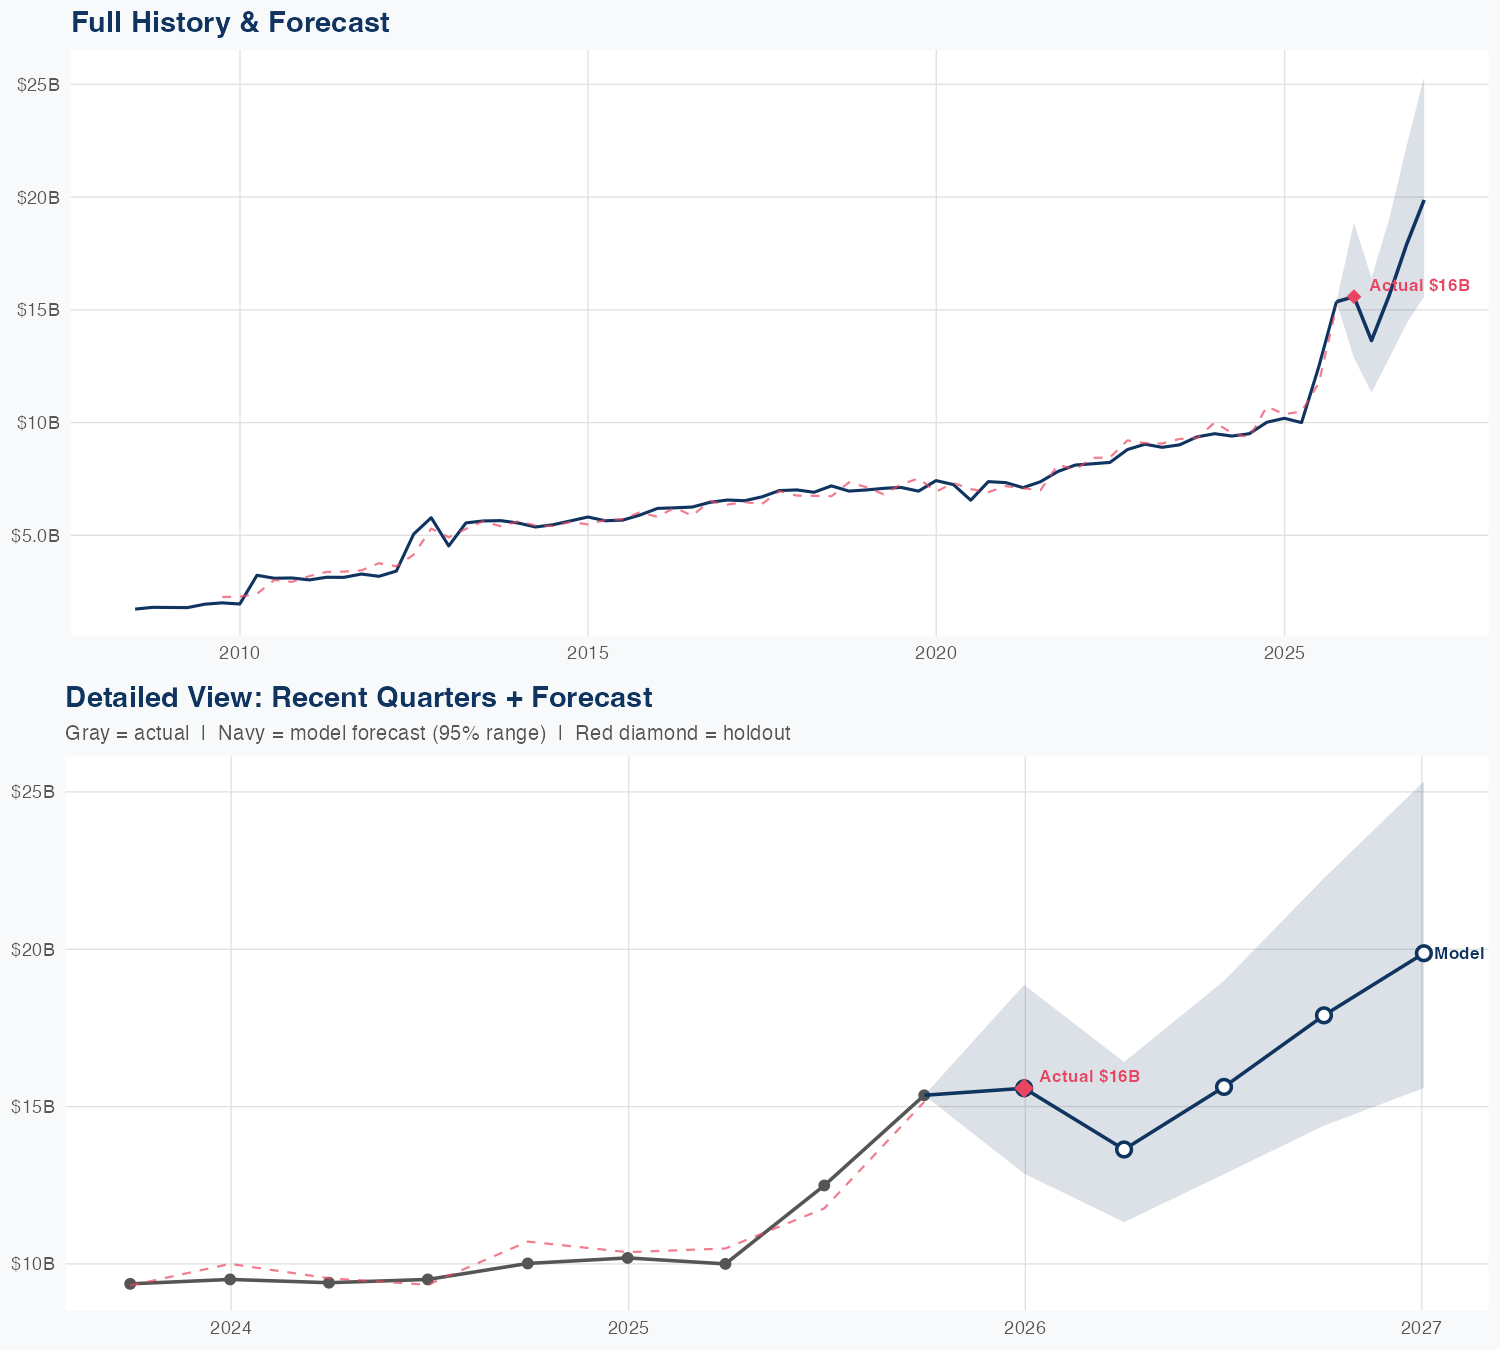
Revenue is forecast to grow about 25% year over year, with the trajectory positive into next year as Capital One leverages structural/platform growth alongside ongoing SG&A investment. Our econometric model attributes roughly 14% of the uplift to structural/platform growth and 86% to SG&A spend, with SG&A elasticity rising—each incremental dollar of SG&A now translating into more revenue. The binding constraint on revenue growth is credit demand and underwriting capacity, i.e., the bank's ability to originate and book new loans while managing risk. Key risk: a sharper slowdown in loan demand or a rise in credit losses and regulatory constraints that limit loan growth would cap upside despite higher SG&A investment.
Investment Thesis
The econometric model achieves strong accuracy (4.7% MAPE), suggesting Capital one financial corp's revenue trajectory is well-characterized by its spending patterns. Sales & marketing spend shows a 1.17x elasticity, suggesting effective go-to-market execution.
Revenue Forecast
Quarterly Detail
| Quarter | Model Forecast | Actual | 95% Range | YoY Growth | Status |
|---|---|---|---|---|---|
| Q4 2025 | $16B | $16B | $13B – $19B | +52.9% | ✓ In range |
| Q2 2026 | $14B | $11B – $16B | +36.4% | ||
| Q3 2026 | $16B | $13B – $19B | +25.1% | ||
| Q4 2026 | $18B | $14B – $22B | +16.5% | ||
| Q1 2027 | $20B | $16B – $25B | +27.5% |
Seasonal Factors
| Fiscal Quarter | Seasonal Factor | vs Trend | Interpretation | Obs. |
|---|---|---|---|---|
| FQ1 (Sep–Nov) | 0.991 | -0.9% | In line with trend | 17 |
| FQ2 (Dec–Feb) | 0.9948 | -0.5% | In line with trend | 17 |
| FQ3 (Mar–May) | 0.9941 | -0.6% | In line with trend | 16 |
| FQ4 (Jun–Aug) | 1.0182 | +1.8% | In line with trend | 16 |
How Spending Drives Revenue
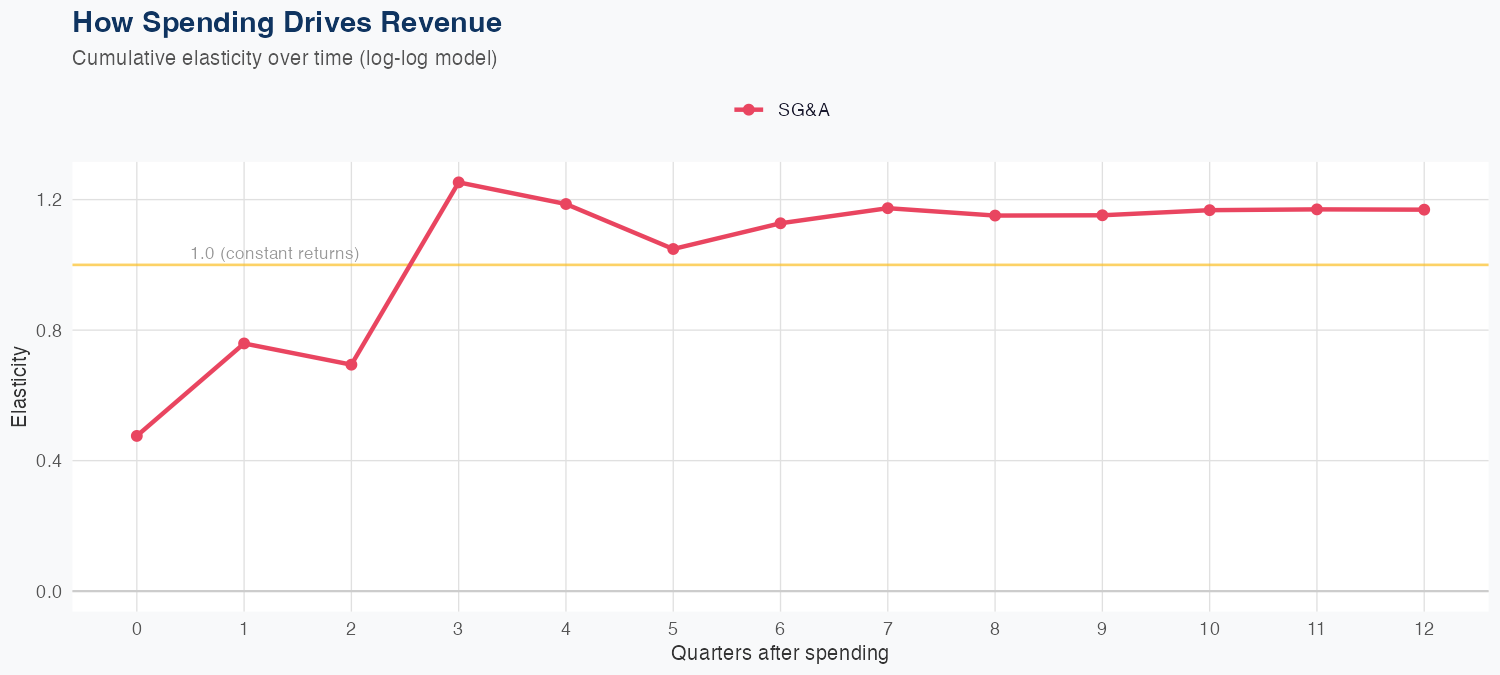
Spending Efficiency Over Time
Current SG&A elasticity: 0.7178x
Want this analysis for your portfolio?
I build custom revenue intelligence reports for investors and companies using SEC filing data, econometric modeling, and AI-powered insights.
Get in Touch