Crowdstrike Holdings, Inc. CRWD
Revenue Intelligence Report • 32 quarters of SEC filing data • Updated 2026-03-15
Revenue is forecast to be about $5.8 billion in FY, up 19.8% year over year, driven by rapid platform adoption and expanding enterprise footprints. Binding constraint: according to our econometric model, elasticities are low and structural growth remains meaningful, so the growth engine is platform scale rather than incremental spend, with CrowdStrike's delivery/onboarding capacity being the critical bottleneck to scale. Our forecast attribution shows structural/platform growth about 43%, SG&A about 54%, and R&D about 3%, with a MAPE of 1.0% and holdout error of +0.2%. Time-varying coefficients from the model indicate operating leverage is increasing, supporting the view that revenue gains come from the platform and pricing power rather than higher spend. Key risk: execution risk in scaling deployment and onboarding across enterprises, which could cap upside if capacity lags or renewal cycles slow.
Investment Thesis
Our ARDL model tracks Crowdstrike Holdings, Inc.'s revenue with exceptional precision (1.0% MAPE), indicating highly predictable cash flows. R&D investment shows a 0.04x multiplier — each 1% increase in R&D spend is associated with a 0.04% revenue increase, signaling strong innovation-to-revenue conversion.
Revenue Forecast
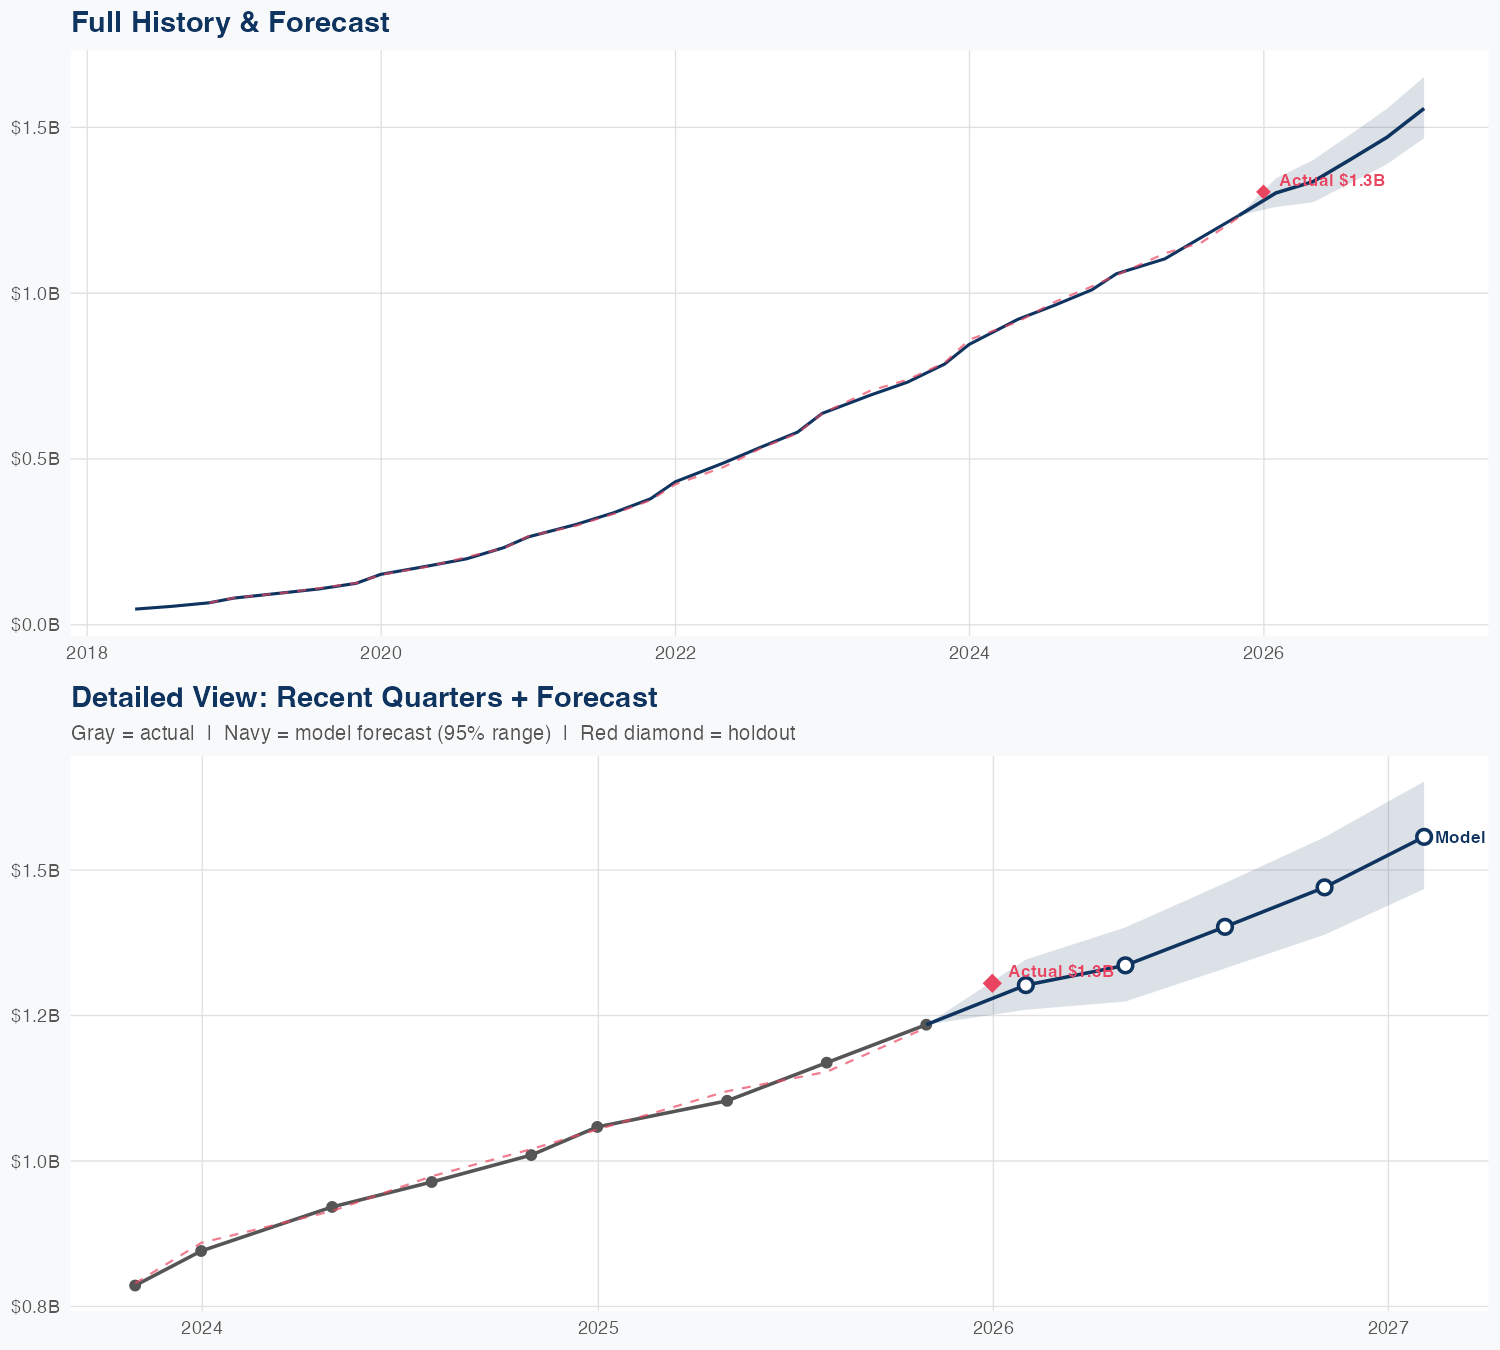
Quarterly Detail
| Quarter | Model Forecast | Actual | 95% Range | YoY Growth | Status |
|---|---|---|---|---|---|
| Q1 2026 | $1.3B | $1.3B | $1.3B – $1.3B | +23.0% | ✓ In range |
| Q2 2026 | $1.3B | $1.3B – $1.4B | +21.1% | ||
| Q3 2026 | $1.4B | $1.3B – $1.5B | +20.0% | ||
| Q4 2026 | $1.5B | $1.4B – $1.6B | +19.1% | ||
| Q1 2027 | $1.6B | $1.5B – $1.7B | +19.3% |
Seasonal Factors
| Fiscal Quarter | Seasonal Factor | vs Trend | Interpretation | Obs. |
|---|---|---|---|---|
| FQ1 (Sep–Nov) | 1.0042 | +0.4% | In line with trend | 8 |
| FQ2 (Dec–Feb) | 1.0008 | +0.1% | In line with trend | 8 |
| FQ3 (Mar–May) | 1.0077 | +0.8% | In line with trend | 7 |
| FQ4 (Jun–Aug) | 0.9899 | -1.0% | In line with trend | 7 |
How Spending Drives Revenue
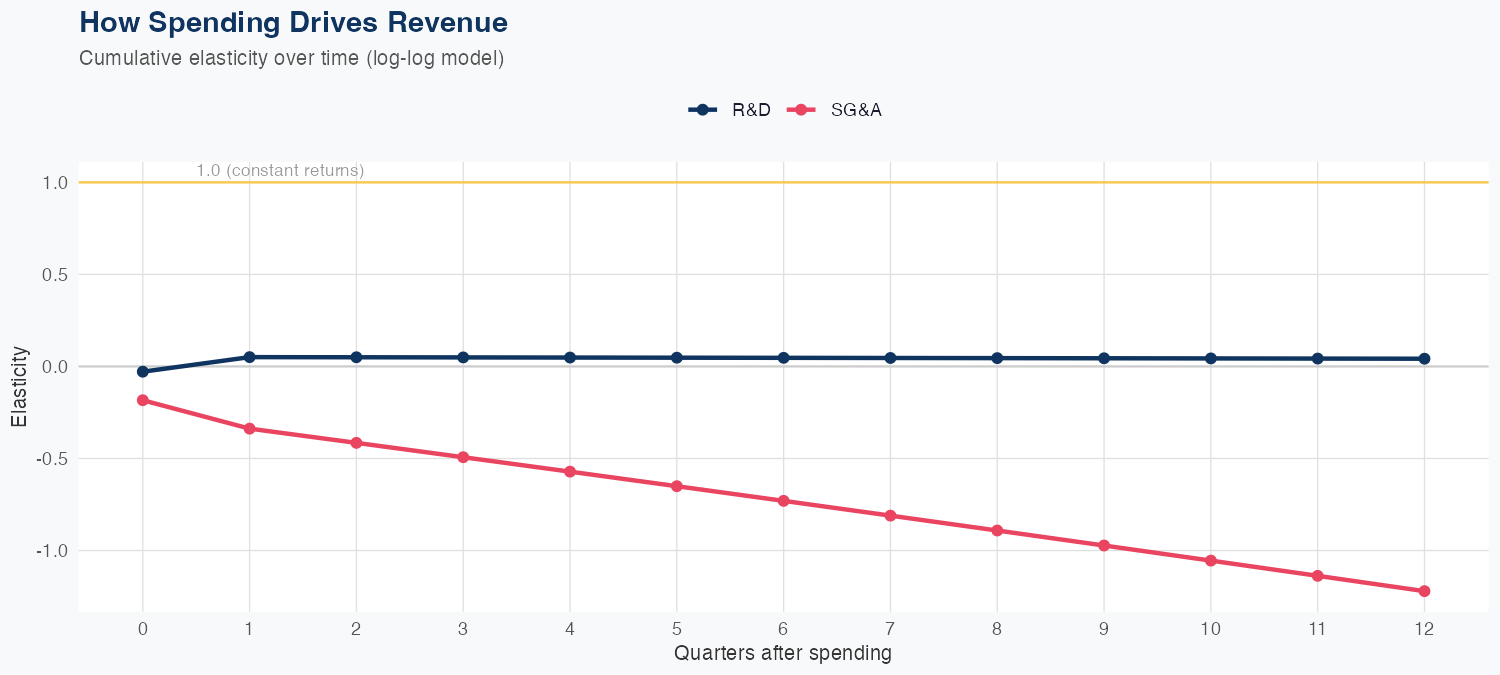
Spending Efficiency Over Time
Current SG&A elasticity: -0.1134x • R&D: 0.0061x
Want this analysis for your portfolio?
I build custom revenue intelligence reports for investors and companies using SEC filing data, econometric modeling, and AI-powered insights.
Get in Touch