Delta Air Lines, Inc. DAL
Revenue Intelligence Report • 64 quarters of SEC filing data • Updated 2026-03-15
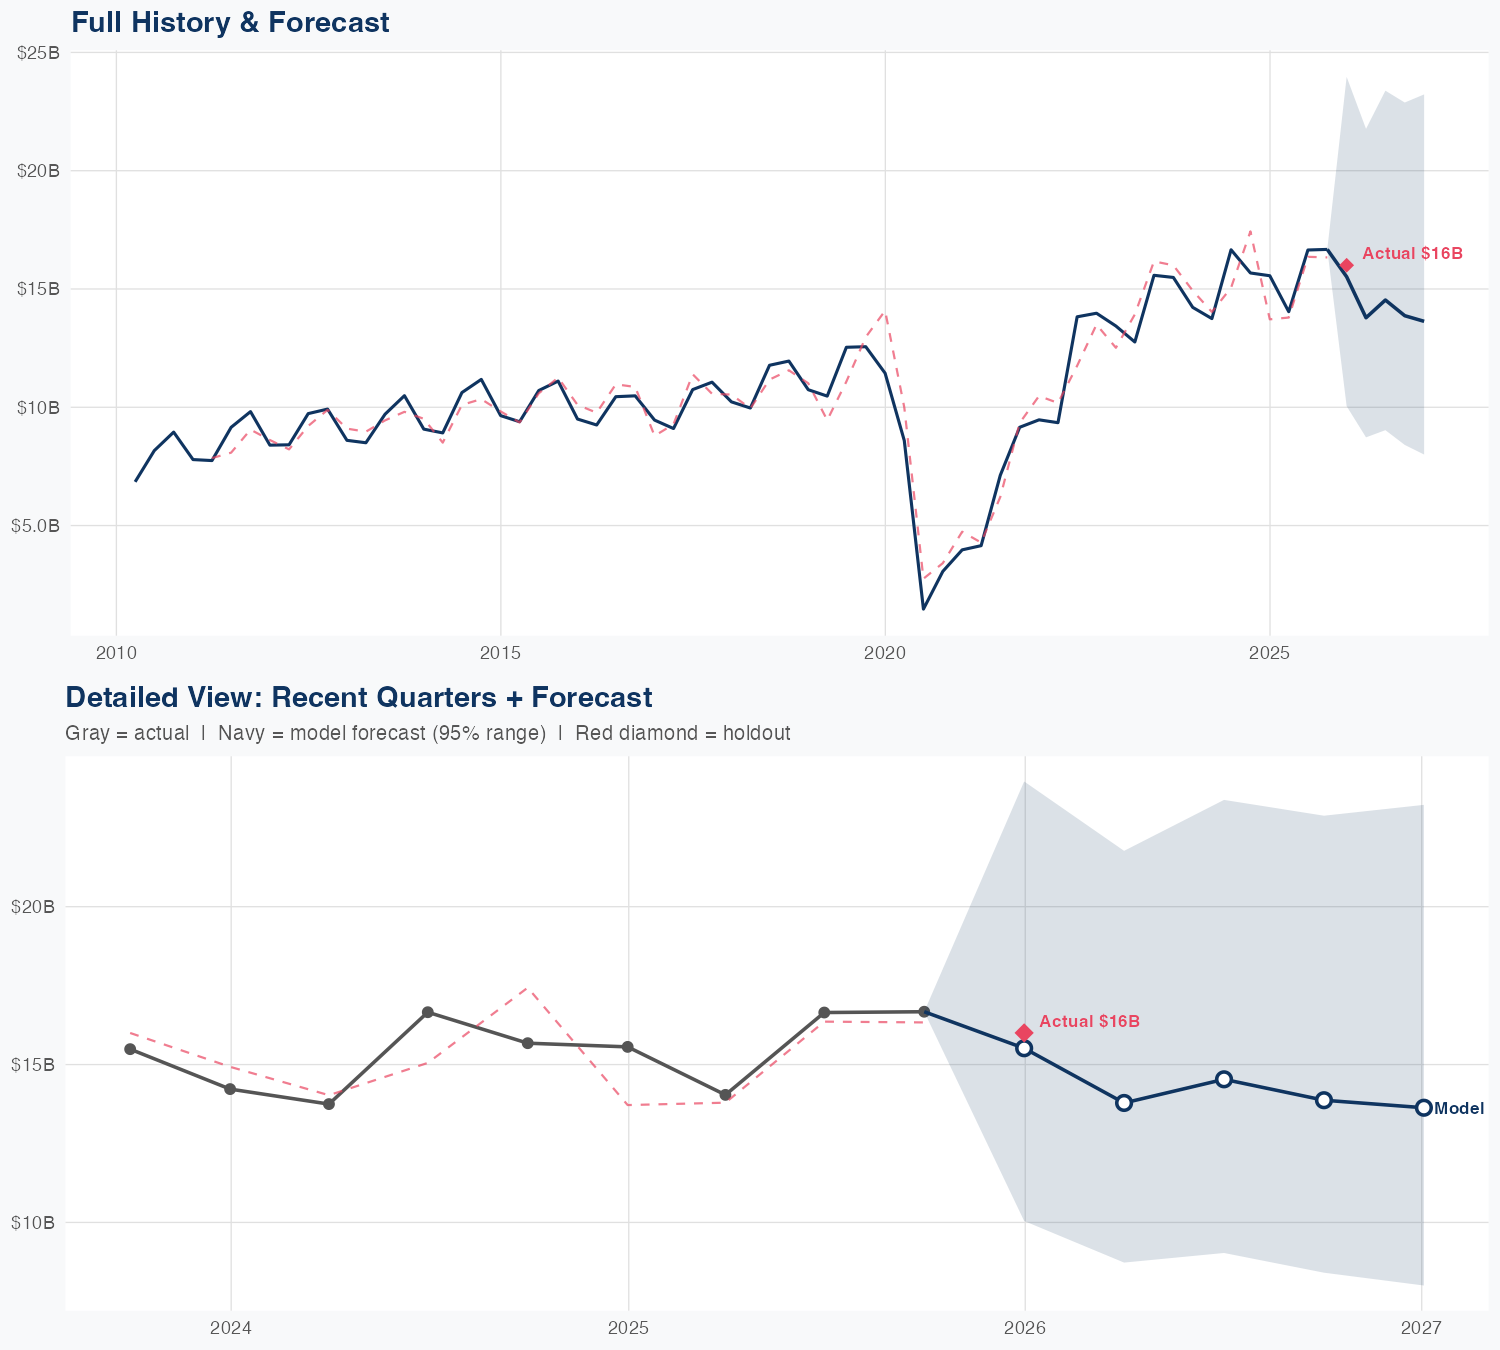
Delta Air Lines’ revenue is forecast to fall about 11.9% year over year, reflecting continued demand normalization and pricing dynamics as the network rebalances after the pandemic. Our econometric model identifies the binding constraint on revenue growth as delivery capacity—aircraft and crew availability and scheduling limits—rather than SG&A or R&D spend. The current growth attribution is roughly 56% structural/platform and 44% from SG&A, with R&D essentially zero, underscoring that the firm’s upside follows scale and pricing rather than incremental spend. Key risk is that capacity constraints persist or worsen, limiting Delta’s ability to translate platform strength into revenue and leaving the outlook exposed to capacity-driven disruptions.
Investment Thesis
The econometric model achieves strong accuracy (7.4% MAPE), suggesting Delta Air Lines, Inc.'s revenue trajectory is well-characterized by its spending patterns. Each $1 of SG&A spending generates $1.94 in revenue, reflecting strong commercial efficiency.
Revenue Forecast
Quarterly Detail
| Quarter | Model Forecast | Actual | 95% Range | YoY Growth | Status |
|---|---|---|---|---|---|
| Q4 2025 | $16B | $16B | $10B – $24B | -0.3% | ✓ In range |
| Q2 2026 | $14B | $8.7B – $22B | -1.8% | ||
| Q3 2026 | $15B | $9.0B – $23B | -12.7% | ||
| Q4 2026 | $14B | $8.4B – $23B | -16.8% | ||
| Q1 2027 | $14B | $8.0B – $23B | -14.8% |
Seasonal Factors
| Fiscal Quarter | Seasonal Factor | vs Trend | Interpretation | Obs. |
|---|---|---|---|---|
| FQ1 (Sep–Nov) | 1.0034 | +0.3% | In line with trend | 15 |
| FQ2 (Dec–Feb) | 0.9708 | -2.9% | In line with trend | 15 |
| FQ3 (Mar–May) | 0.9805 | -1.9% | In line with trend | 15 |
| FQ4 (Jun–Aug) | 1.0516 | +5.2% | +5.2% above trend | 15 |
How Spending Drives Revenue
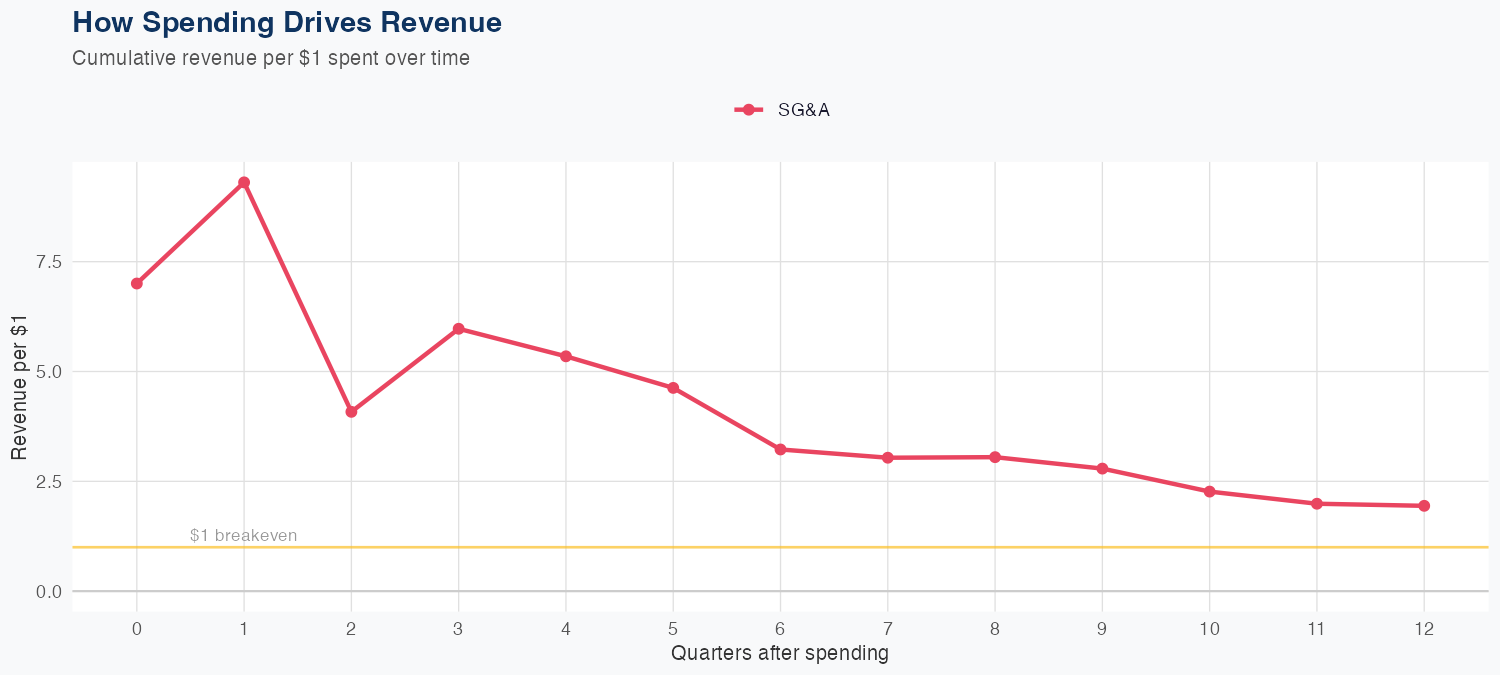
Spending Efficiency Over Time
Current SG&A multiplier: 1.5575
Want this analysis for your portfolio?
I build custom revenue intelligence reports for investors and companies using SEC filing data, econometric modeling, and AI-powered insights.
Get in Touch