Duke Energy Corporation DUK
Revenue Intelligence Report • 68 quarters of SEC filing data • Updated 2026-03-15
Revenue is forecast to grow about 5% year over year, supported by steady expansion in regulated utility activity and ongoing capital investments that underpin rate-based earnings. Binding constraint: SG&A investment capacity—the ability to fund additional SG&A spending to unlock further topline growth. Our econometric model attributes roughly 6% of the forecast growth to structural/platform factors and about 94% to SG&A spending, with the SG&A multiplier rising from 0.69 to 0.81, implying spending is increasingly effective at lifting revenue. MAPEs are 4.4% with a holdout error of -2.4%, indicating the forecast remains reasonably accurate. Key risk: if the SG&A investment capacity cannot scale or ROI deteriorates, the anticipated growth may underperform.
Investment Thesis
The econometric model achieves strong accuracy (4.4% MAPE), suggesting Duke Energy Corporation's revenue trajectory is well-characterized by its spending patterns. Each $1 of SG&A spending generates $1.31 in revenue, reflecting strong commercial efficiency.
Revenue Forecast
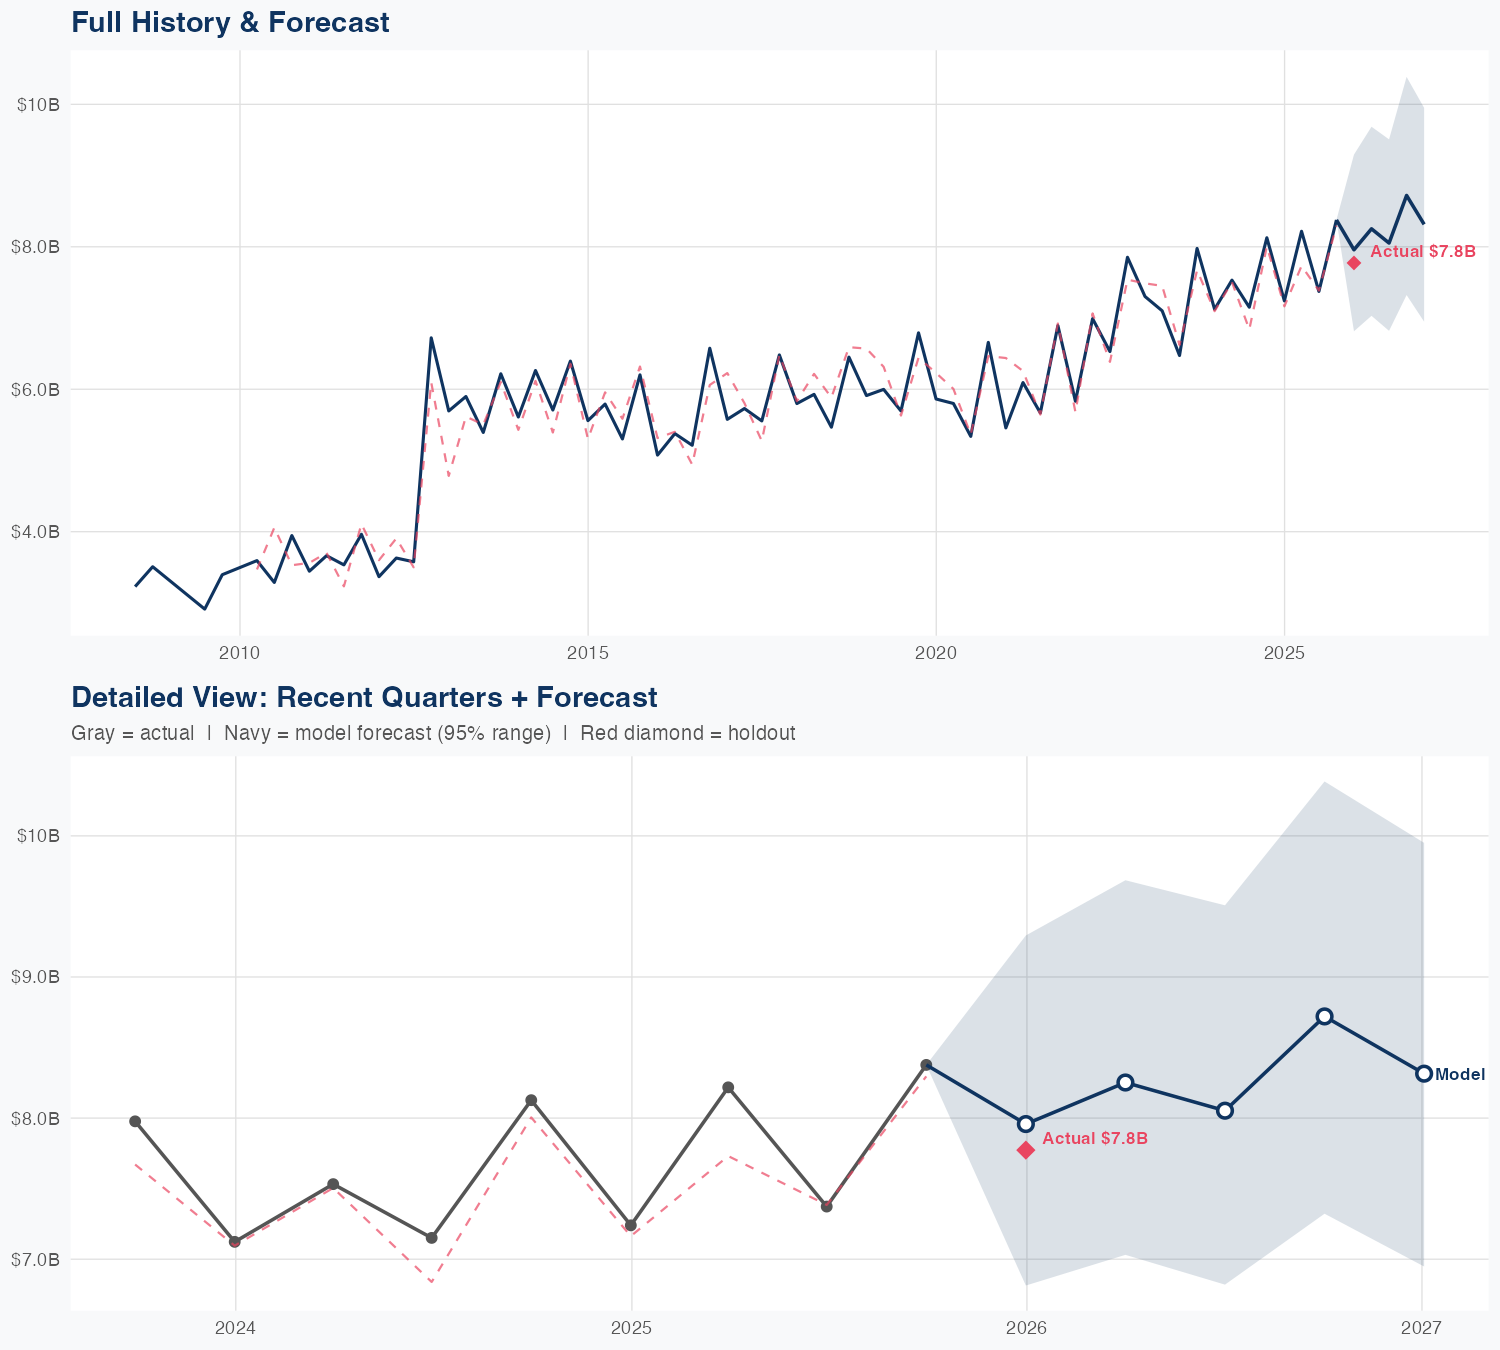
Quarterly Detail
| Quarter | Model Forecast | Actual | 95% Range | YoY Growth | Status |
|---|---|---|---|---|---|
| Q4 2025 | $8.0B | $7.8B | $6.8B – $9.3B | +9.9% | ✓ In range |
| Q2 2026 | $8.3B | $7.0B – $9.7B | +0.4% | ||
| Q3 2026 | $8.1B | $6.8B – $9.5B | +9.2% | ||
| Q4 2026 | $8.7B | $7.3B – $10B | +4.1% | ||
| Q1 2027 | $8.3B | $6.9B – $10.0B | +7.0% |
Seasonal Factors
| Fiscal Quarter | Seasonal Factor | vs Trend | Interpretation | Obs. |
|---|---|---|---|---|
| FQ1 (Sep–Nov) | 1.019 | +1.9% | In line with trend | 16 |
| FQ2 (Dec–Feb) | 0.9944 | -0.6% | In line with trend | 16 |
| FQ3 (Mar–May) | 0.9891 | -1.1% | In line with trend | 16 |
| FQ4 (Jun–Aug) | 1.0115 | +1.2% | In line with trend | 16 |
How Spending Drives Revenue
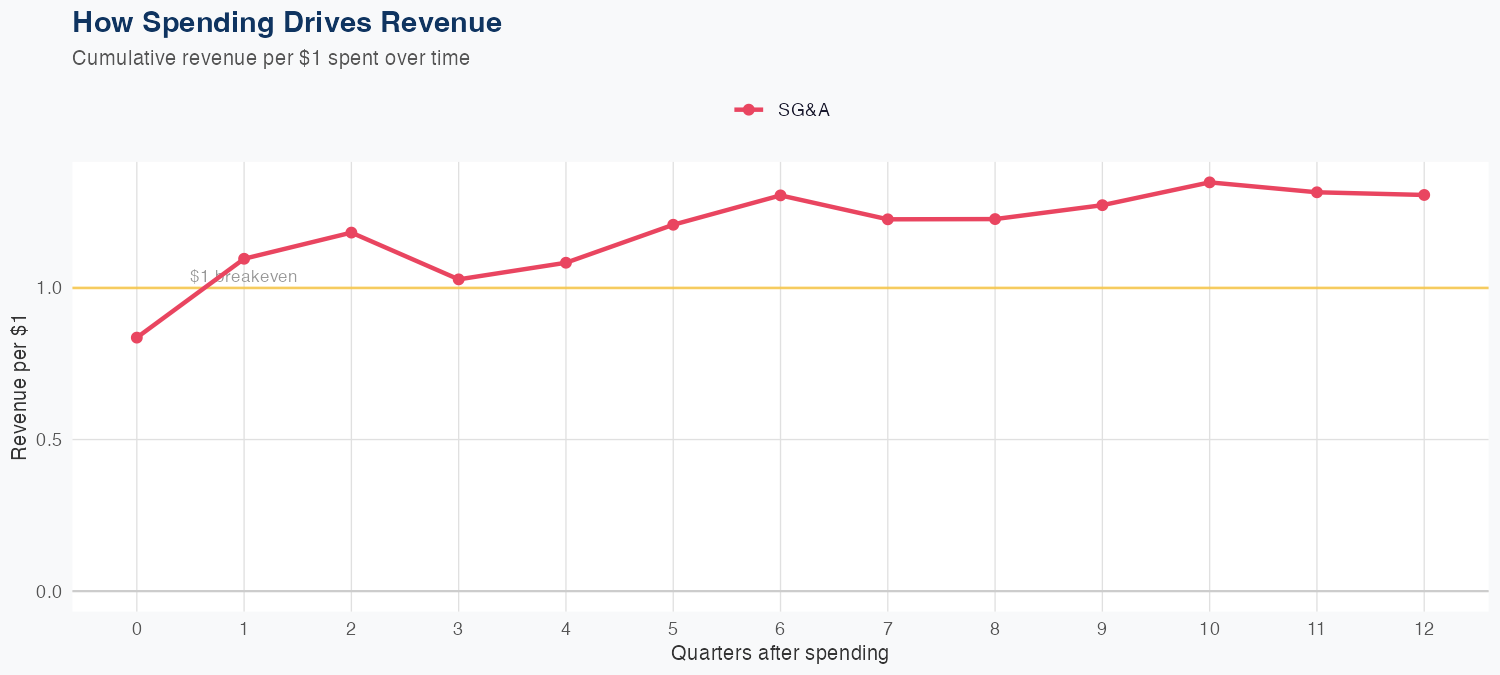
Spending Efficiency Over Time
Current SG&A multiplier: 0.8132
Want this analysis for your portfolio?
I build custom revenue intelligence reports for investors and companies using SEC filing data, econometric modeling, and AI-powered insights.
Get in Touch