Consolidated Edison, Inc. ED
Revenue Intelligence Report • 65 quarters of SEC filing data • Updated 2026-03-15
Revenue is expected to grow roughly 7% year over year to about $19.5 billion, supported by structural/platform growth and ongoing investments in operating capabilities. Binding constraint: regulatory approvals and the timing of rate-case cycles for rate-base investments limit how quickly SG&A-driven spending can translate into revenue. Our econometric model shows elasticities are high and rising, meaning incremental SG&A and capital deployment tend to magnify top-line gains. Current attribution assigns about 8% to structural/platform growth and roughly 92% to SG&A-driven expansion, implying the growth engine remains investment-led rather than product- or capacity-constrained. Key risk: delays or tightening outcomes in regulatory approvals for rate-base investments could cap upside even as demand remains robust.
Investment Thesis
Our ARDL model tracks Consolidated Edison, Inc.'s revenue with exceptional precision (1.9% MAPE), indicating highly predictable cash flows. Sales & marketing spend shows a 0.82x elasticity, suggesting effective go-to-market execution.
Revenue Forecast
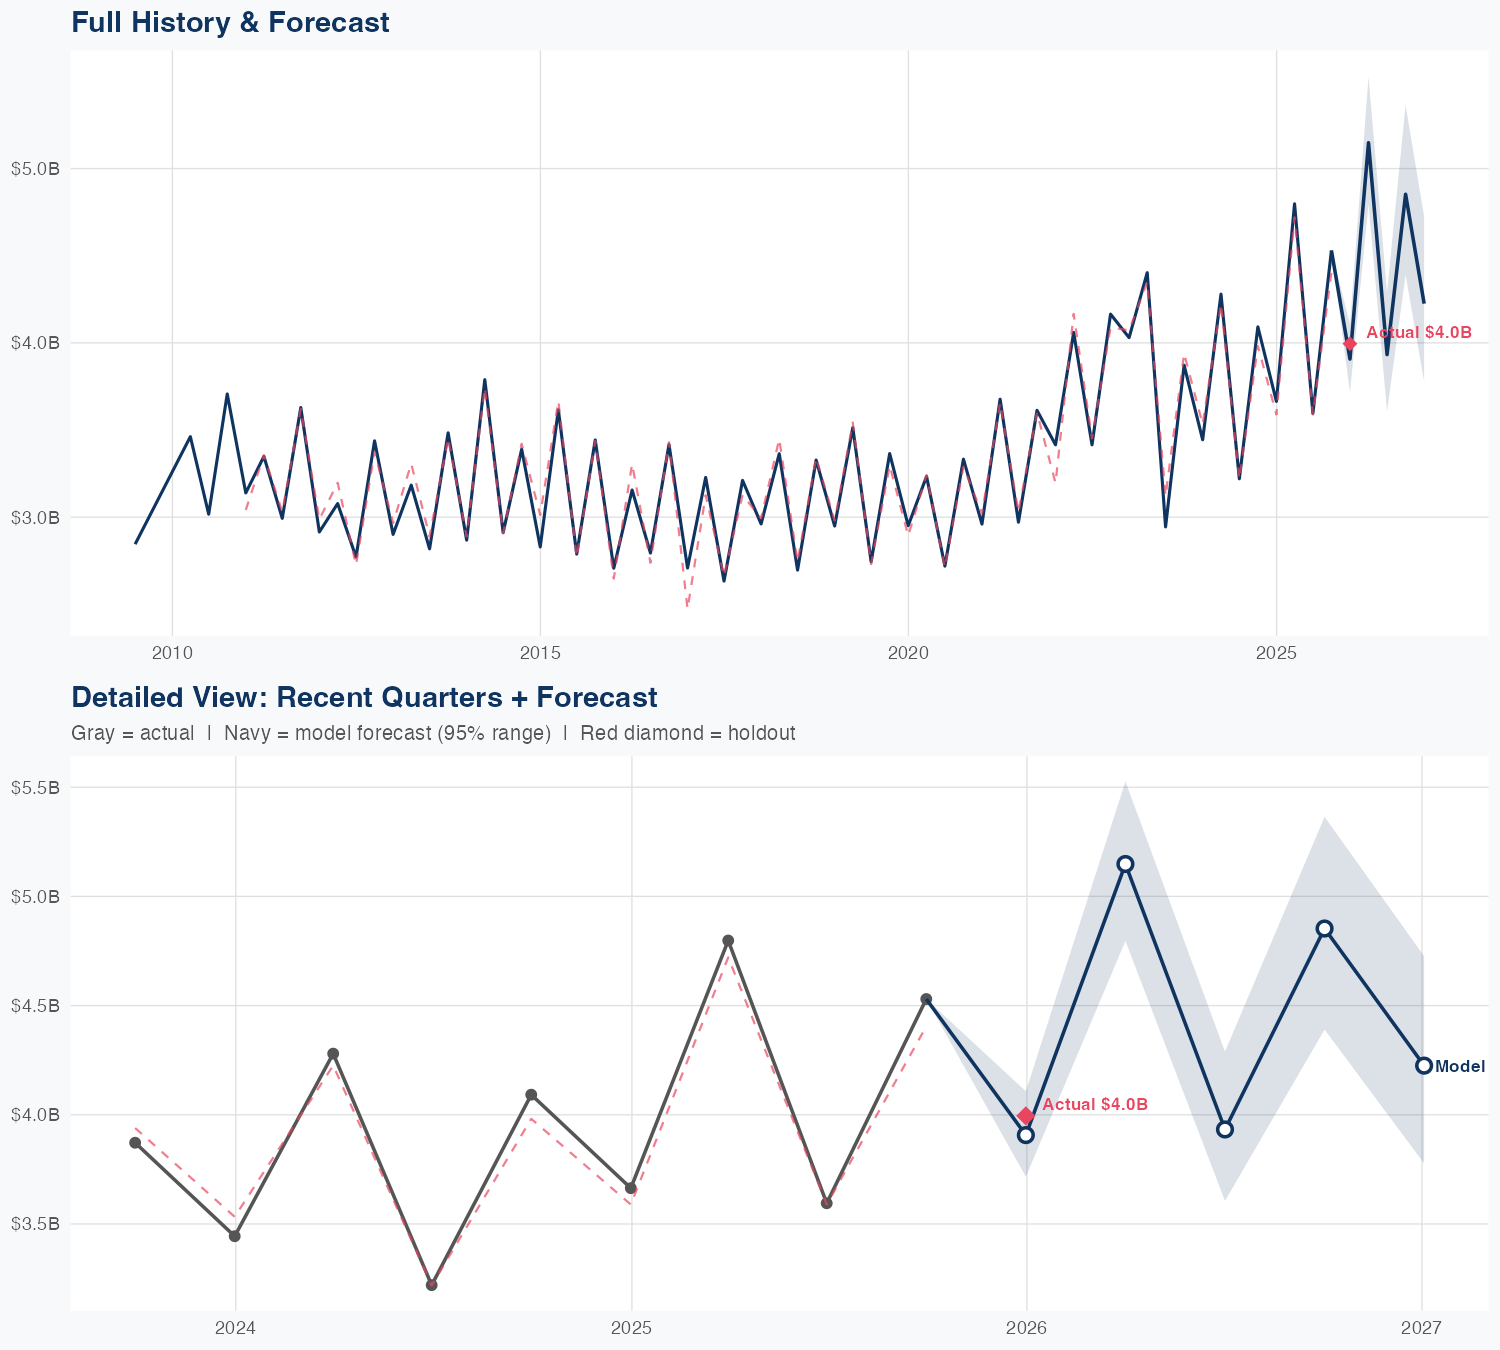
Quarterly Detail
| Quarter | Model Forecast | Actual | 95% Range | YoY Growth | Status |
|---|---|---|---|---|---|
| Q4 2025 | $3.9B | $4.0B | $3.7B – $4.1B | +6.6% | ✓ In range |
| Q2 2026 | $5.1B | $4.8B – $5.5B | +7.3% | ||
| Q3 2026 | $3.9B | $3.6B – $4.3B | +9.4% | ||
| Q4 2026 | $4.9B | $4.4B – $5.4B | +7.1% | ||
| Q1 2027 | $4.2B | $3.8B – $4.7B | +5.8% |
Seasonal Factors
| Fiscal Quarter | Seasonal Factor | vs Trend | Interpretation | Obs. |
|---|---|---|---|---|
| FQ1 (Sep–Nov) | 1.0086 | +0.9% | In line with trend | 15 |
| FQ2 (Dec–Feb) | 0.9928 | -0.7% | In line with trend | 16 |
| FQ3 (Mar–May) | 0.9977 | -0.2% | In line with trend | 15 |
| FQ4 (Jun–Aug) | 1.0005 | +0.1% | In line with trend | 15 |
How Spending Drives Revenue
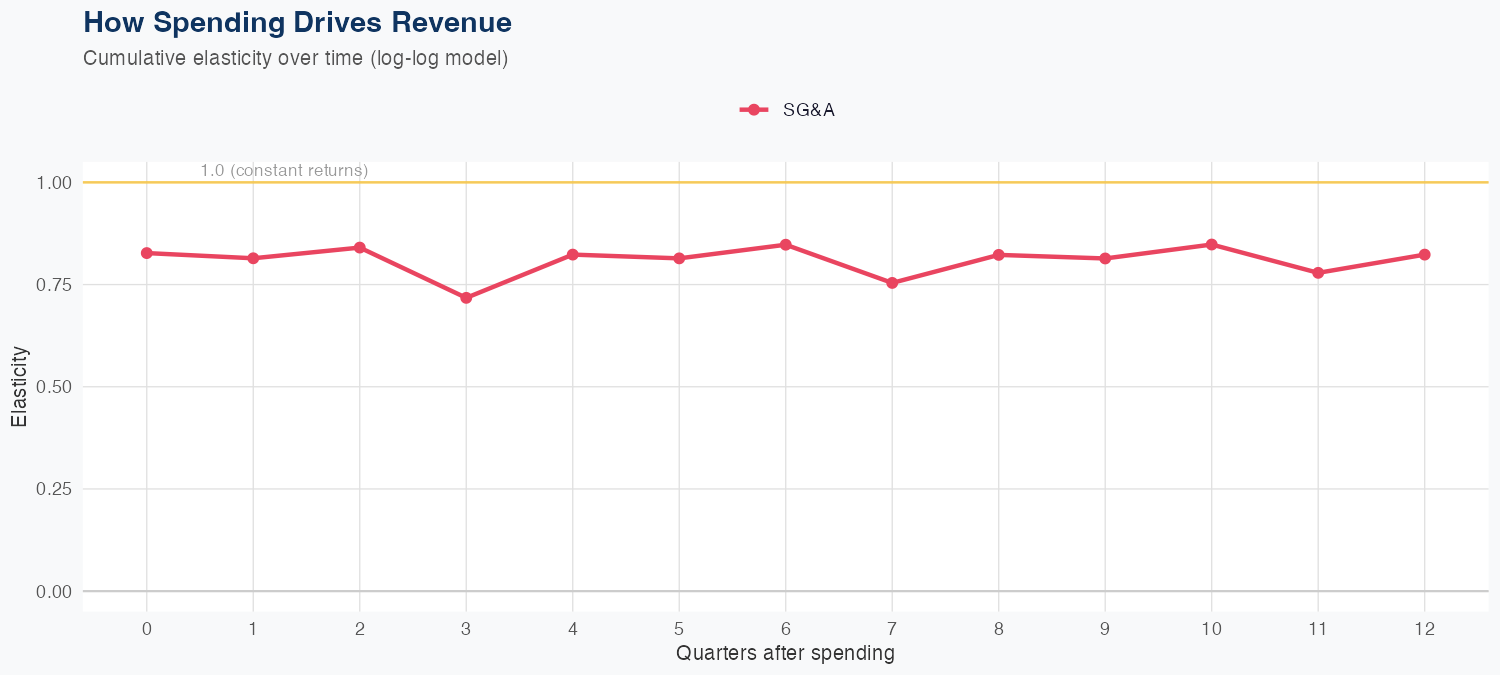
Spending Efficiency Over Time
Current SG&A elasticity: 1.2767x
Want this analysis for your portfolio?
I build custom revenue intelligence reports for investors and companies using SEC filing data, econometric modeling, and AI-powered insights.
Get in Touch