Edison International EIX
Revenue Intelligence Report • 70 quarters of SEC filing data • Updated 2026-03-15
Revenue is expected to decline about 1.4% year over year, coming in near $19.1 billion, with only modest near-term growth as macro headwinds offset the structural/platform uplift. Our econometric model signals the binding constraint on revenue growth is delivery capacity—the grid and related service operations; without the ability to physically deliver and monetize SG&A-driven investments, upside is capped. Time-varying analysis shows the SG&A multiplier has risen from roughly 0.10 to about 0.60, indicating incremental SG&A spending now generates meaningfully more topline growth. The key risk is regulatory rate-case timing and permitting pace, which governs cost recovery and capex monetization and could throttle expected upside.
Investment Thesis
The econometric model achieves strong accuracy (7.1% MAPE), suggesting Edison International's revenue trajectory is well-characterized by its spending patterns. Each $1 of SG&A spending generates $0.79 in revenue, reflecting strong commercial efficiency.
Revenue Forecast
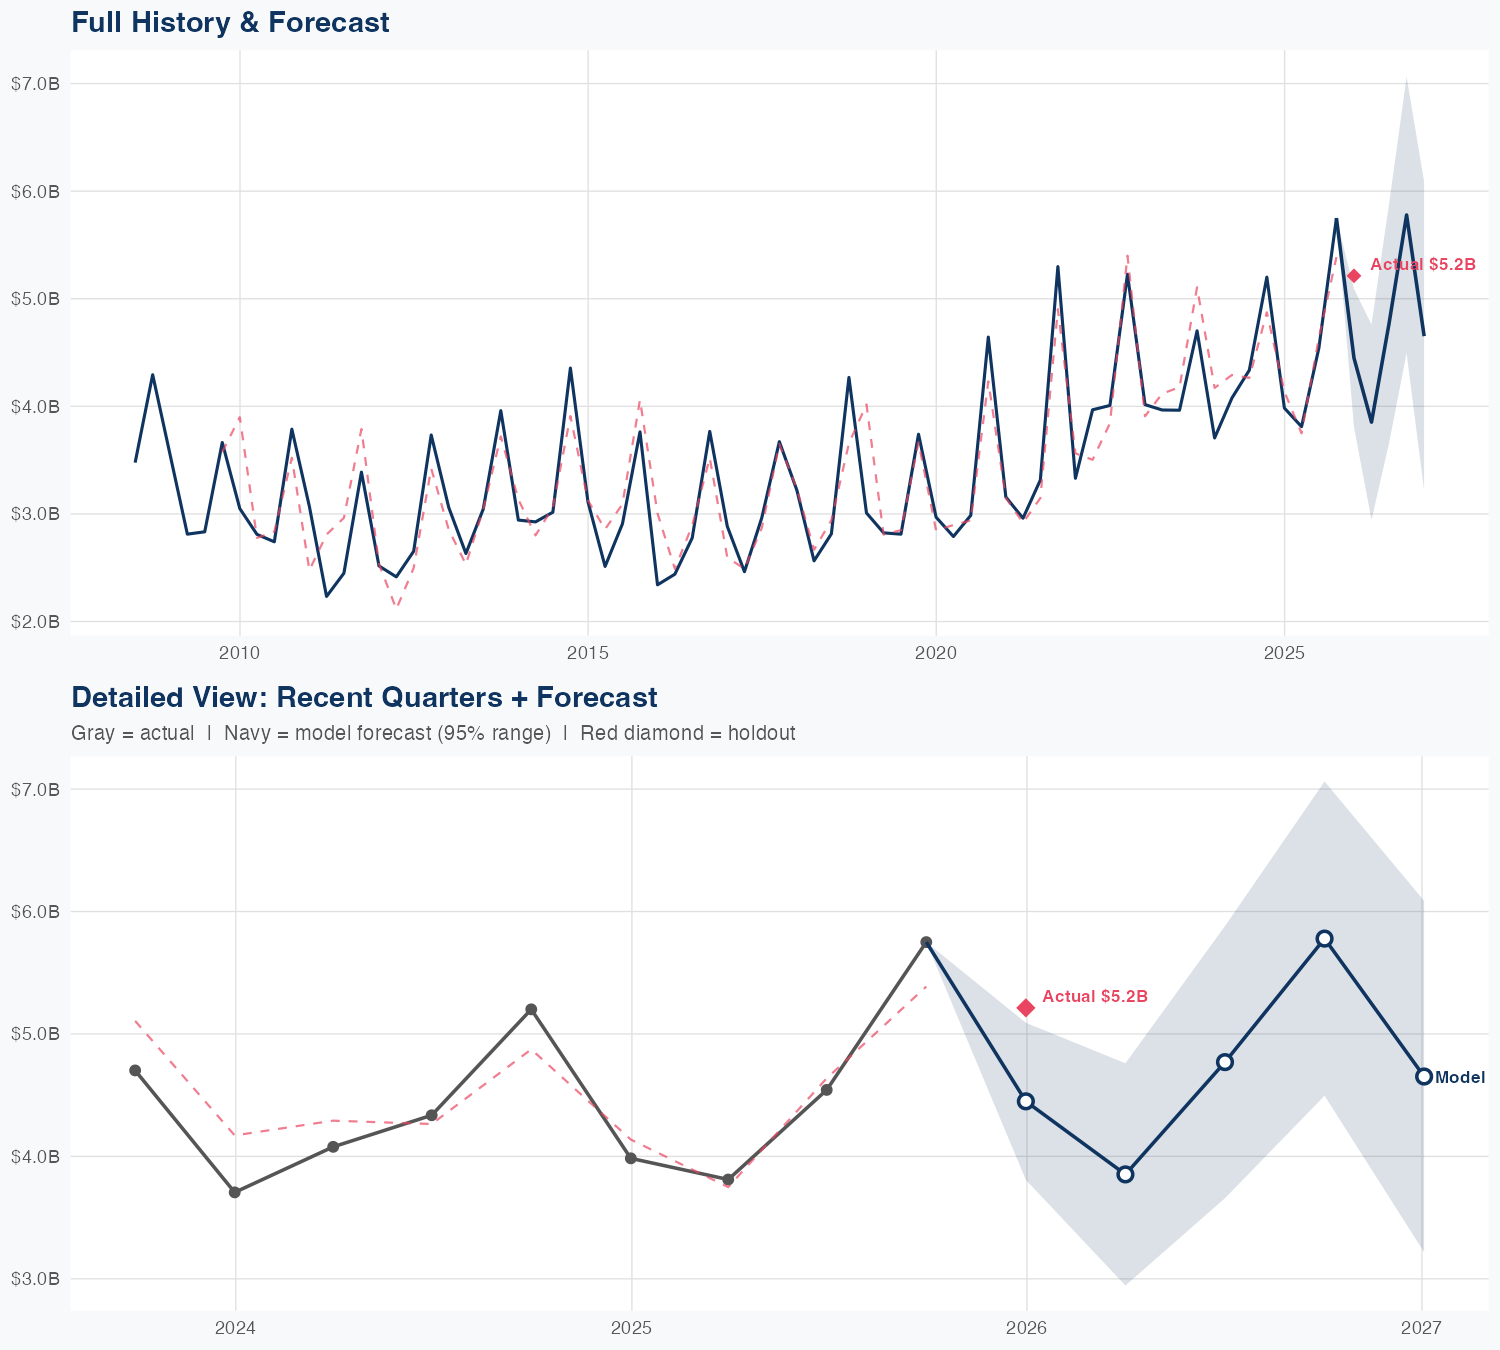
Quarterly Detail
| Quarter | Model Forecast | Actual | 95% Range | YoY Growth | Status |
|---|---|---|---|---|---|
| Q4 2025 | $4.4B | $5.2B | $3.8B – $5.1B | +11.7% | ✗ Outside range |
| Q2 2026 | $3.9B | $2.9B – $4.8B | +1.1% | ||
| Q3 2026 | $4.8B | $3.7B – $5.9B | +5.0% | ||
| Q4 2026 | $5.8B | $4.5B – $7.1B | +0.5% | ||
| Q1 2027 | $4.7B | $3.2B – $6.1B | -10.8% |
Seasonal Factors
| Fiscal Quarter | Seasonal Factor | vs Trend | Interpretation | Obs. |
|---|---|---|---|---|
| FQ1 (Sep–Nov) | 1.067 | +6.7% | +6.7% above trend | 17 |
| FQ2 (Dec–Feb) | 0.9957 | -0.4% | In line with trend | 17 |
| FQ3 (Mar–May) | 1.0058 | +0.6% | In line with trend | 16 |
| FQ4 (Jun–Aug) | 0.987 | -1.3% | In line with trend | 16 |
How Spending Drives Revenue
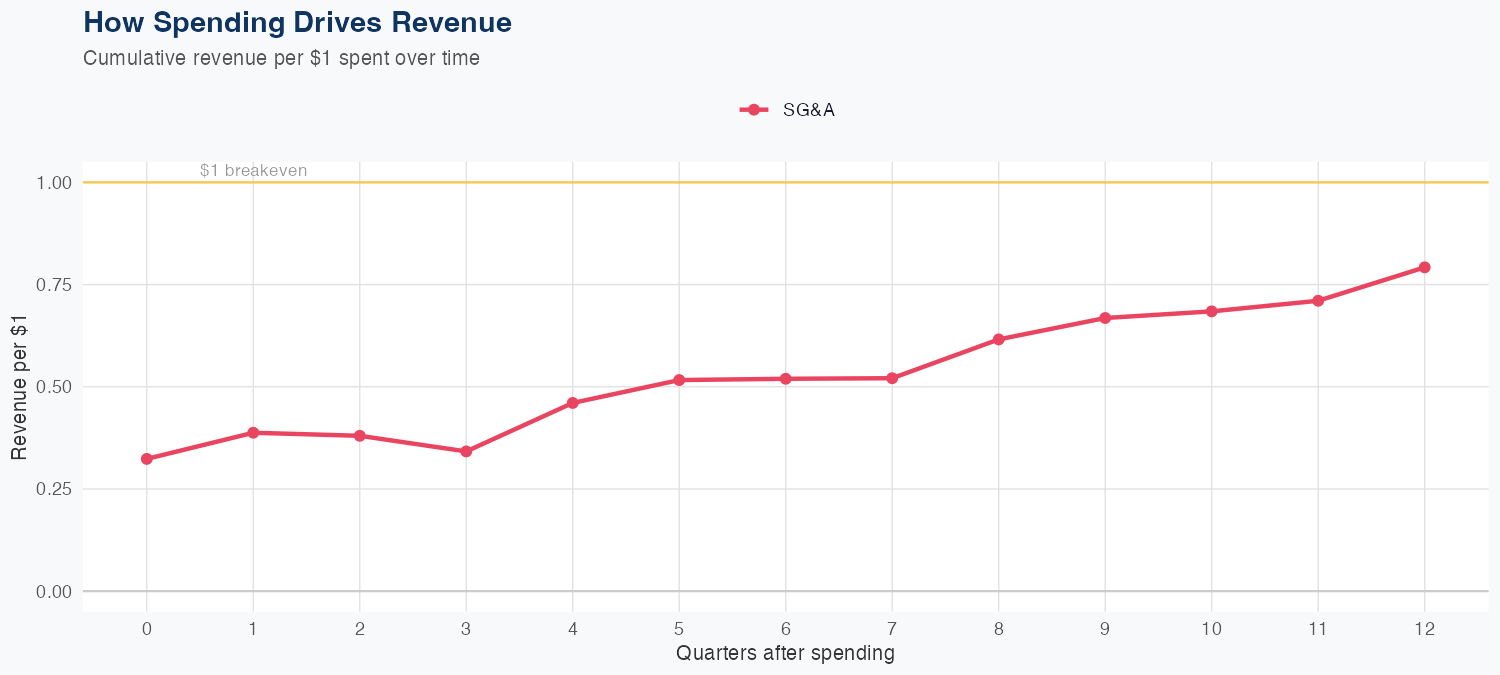
Spending Efficiency Over Time
Current SG&A multiplier: 0.5862
Want this analysis for your portfolio?
I build custom revenue intelligence reports for investors and companies using SEC filing data, econometric modeling, and AI-powered insights.
Get in Touch