Eversource Energy ES
Revenue Intelligence Report • 62 quarters of SEC filing data • Updated 2026-03-15
Eversource’s revenue is forecast to grow about 14% year over year, reaching roughly $17.7 billion, as rate-base expansion supports the top line and operating leverage adds to the growth trajectory, with structural growth running around 3%. Binding constraint: regulatory capex approvals and the cadence of rate cases that govern allowed capital investments and returns—the speed at which capital translates into higher revenue is the true limiter. Our econometric model shows structural/platform growth of about 3% and SG&A-driven expansion accounting for the rest; the SG&A multiplier has declined from 0.95 to 0.91, signaling improving operating leverage and revenue generation beyond incremental spending. Key risk: regulatory delays or capex execution risk could throttle rate-base growth and limit earnings upside.
Investment Thesis
Our ARDL model tracks Eversource Energy's revenue with exceptional precision (2.3% MAPE), indicating highly predictable cash flows. Each $1 of SG&A spending generates $1.26 in revenue, reflecting strong commercial efficiency.
Revenue Forecast
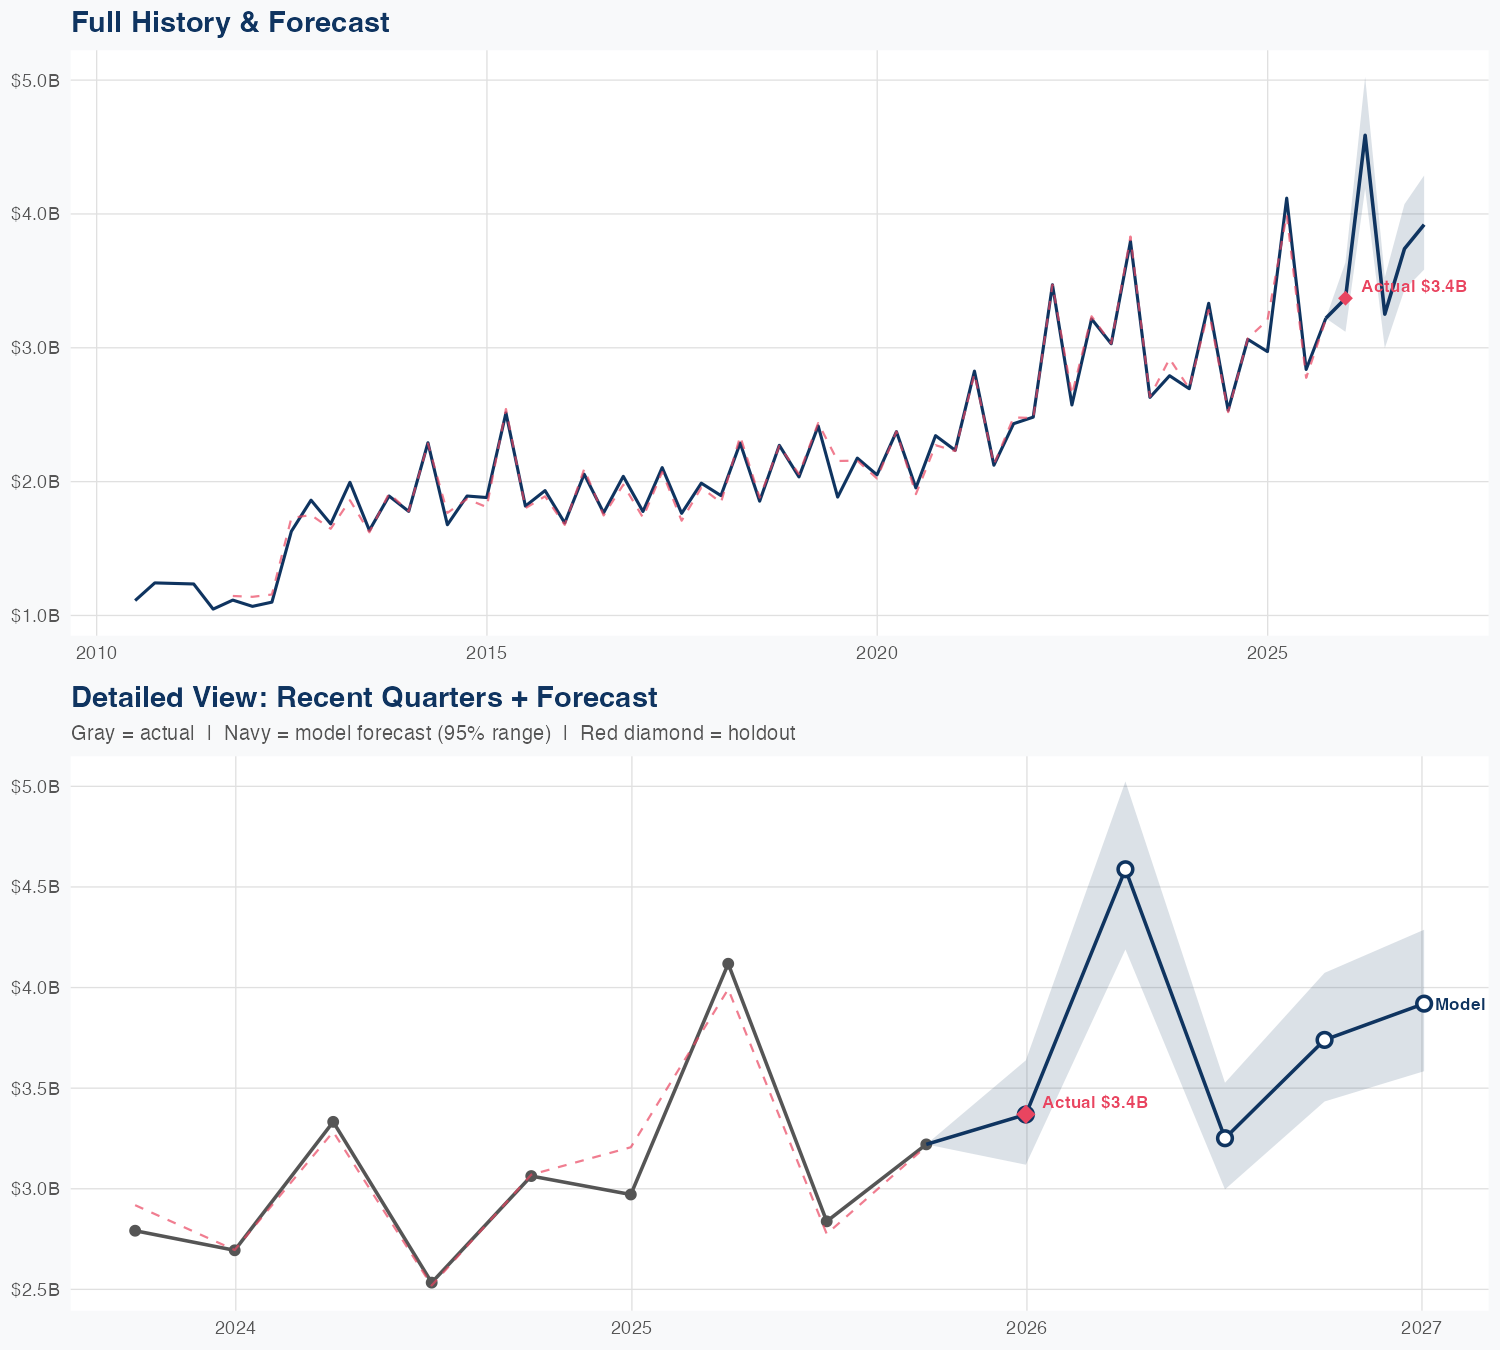
Quarterly Detail
| Quarter | Model Forecast | Actual | 95% Range | YoY Growth | Status |
|---|---|---|---|---|---|
| Q4 2025 | $3.4B | $3.4B | $3.1B – $3.6B | +13.4% | ✓ In range |
| Q2 2026 | $4.6B | $4.2B – $5.0B | +11.4% | ||
| Q3 2026 | $3.3B | $3.0B – $3.5B | +14.6% | ||
| Q4 2026 | $3.7B | $3.4B – $4.1B | +16.1% | ||
| Q1 2027 | $3.9B | $3.6B – $4.3B | +16.3% |
Seasonal Factors
| Fiscal Quarter | Seasonal Factor | vs Trend | Interpretation | Obs. |
|---|---|---|---|---|
| FQ1 (Sep–Nov) | 1.0029 | +0.3% | In line with trend | 15 |
| FQ2 (Dec–Feb) | 1.0028 | +0.3% | In line with trend | 15 |
| FQ3 (Mar–May) | 0.9999 | -0.0% | In line with trend | 14 |
| FQ4 (Jun–Aug) | 1.0057 | +0.6% | In line with trend | 14 |
How Spending Drives Revenue
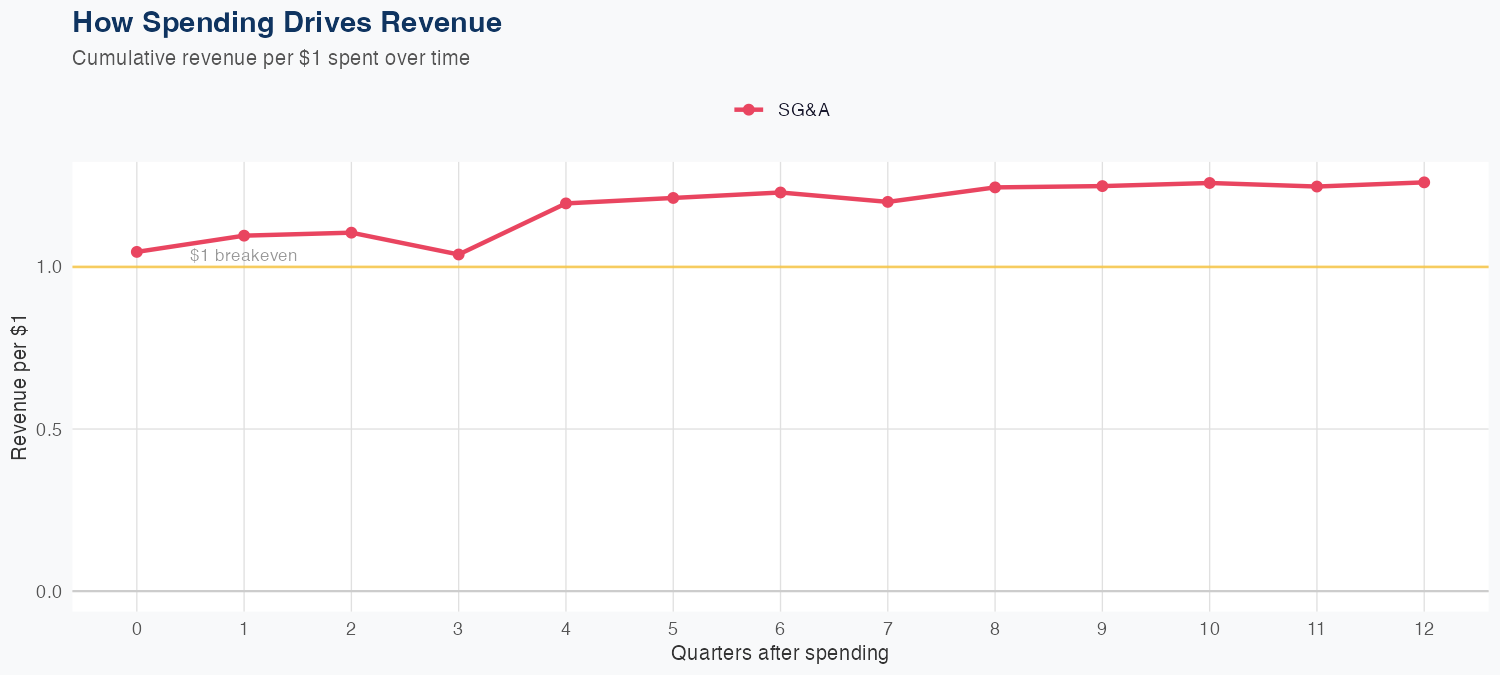
Spending Efficiency Over Time
Current SG&A multiplier: 0.9057
Want this analysis for your portfolio?
I build custom revenue intelligence reports for investors and companies using SEC filing data, econometric modeling, and AI-powered insights.
Get in Touch