Essex Property Trust, Inc. ESS
Revenue Intelligence Report • 66 quarters of SEC filing data • Updated 2026-03-15
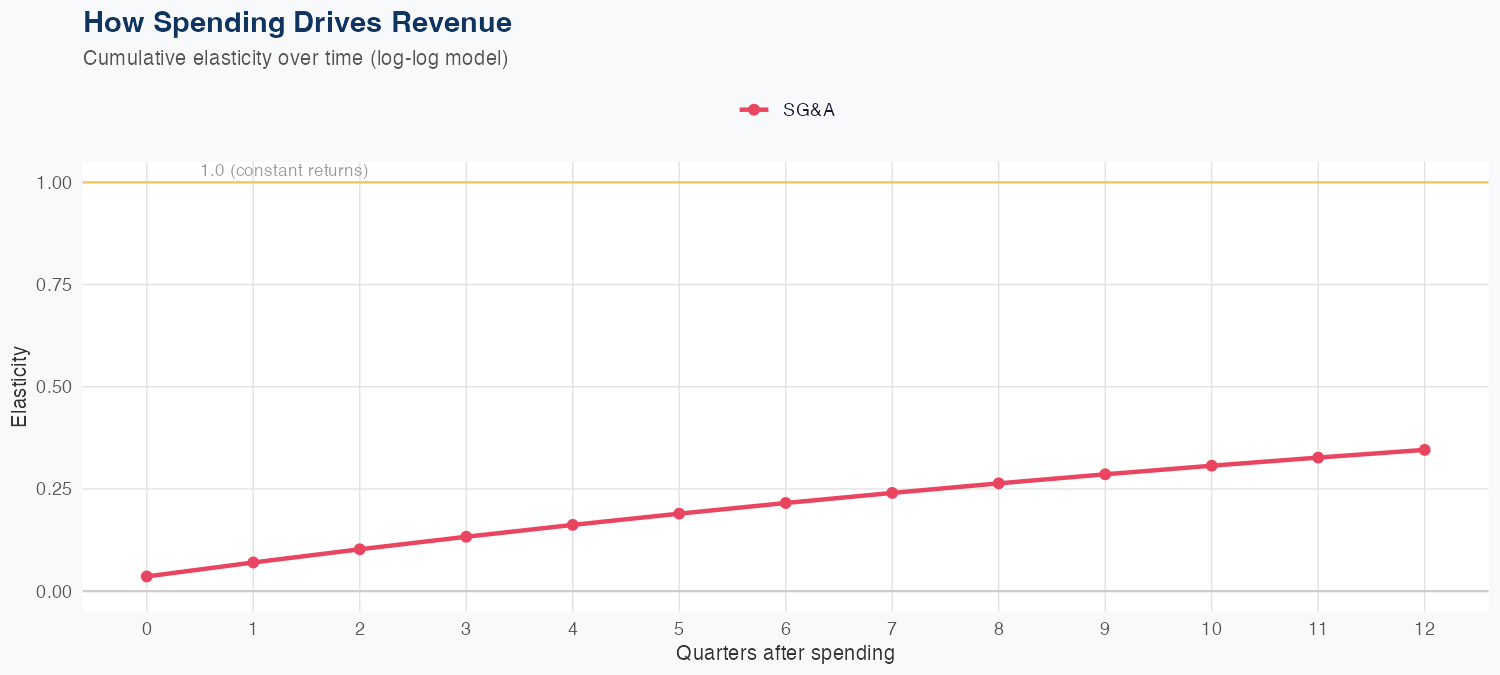
Revenue growth is driven by SG&A investments, with an elasticity of 0.35 in a log-log model, so a 1% increase in SG&A is associated with a 0.35% increase in revenue. The model’s holdout test confirms reliability, with the latest quarter revenue predicted at $480M and actual at $480M (−0.1% error) and an overall MAPE of 2.2%. The FY forecast projects about $1,975M in revenue, up 4.7% year over year, signaling steady growth under the current spend framework. ROI on SG&A spending is positive but modest; incremental revenue gains from SG&A should be weighed against profitability, and margin improvements will hinge on cost discipline and productivity.
Investment Thesis
Our ARDL model tracks Essex Property Trust, Inc.'s revenue with exceptional precision (2.2% MAPE), indicating highly predictable cash flows. Sales & marketing spend shows a 0.35x elasticity, suggesting effective go-to-market execution.
Revenue Forecast
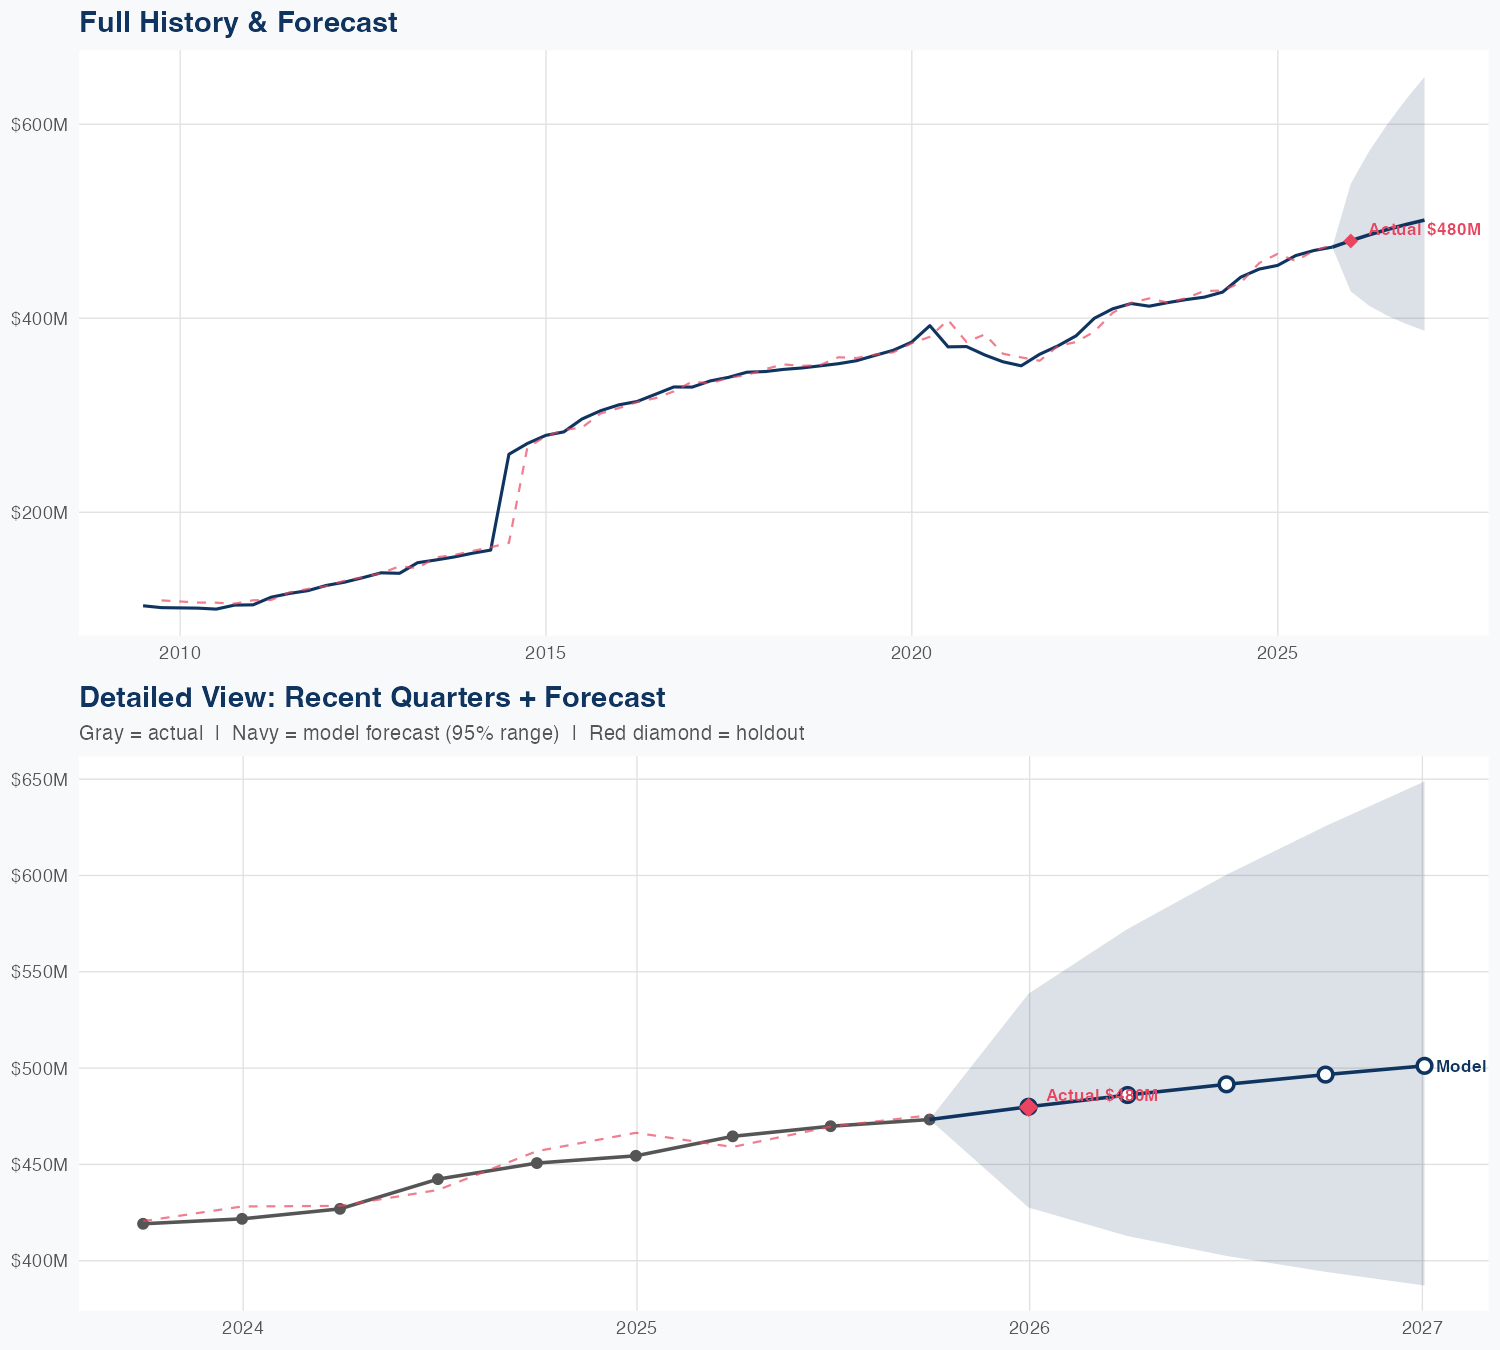
Quarterly Detail
| Quarter | Model Forecast | Actual | 95% Range | YoY Growth | Status |
|---|---|---|---|---|---|
| Q4 2025 | $480B | $480B | $428B – $539B | +5.6% | ✓ In range |
| Q2 2026 | $486B | $413B – $572B | +4.6% | ||
| Q3 2026 | $492B | $402B – $600B | +4.6% | ||
| Q4 2026 | $497B | $394B – $626B | +4.9% | ||
| Q1 2027 | $501B | $387B – $649B | +4.5% |
Seasonal Factors
| Fiscal Quarter | Seasonal Factor | vs Trend | Interpretation | Obs. |
|---|---|---|---|---|
| FQ1 (Sep–Nov) | 0.9978 | -0.2% | In line with trend | 17 |
| FQ2 (Dec–Feb) | 0.9927 | -0.7% | In line with trend | 16 |
| FQ3 (Mar–May) | 0.9963 | -0.4% | In line with trend | 16 |
| FQ4 (Jun–Aug) | 0.9995 | -0.0% | In line with trend | 16 |
How Spending Drives Revenue
Want this analysis for your portfolio?
I build custom revenue intelligence reports for investors and companies using SEC filing data, econometric modeling, and AI-powered insights.
Get in Touch