Energy Transfer Lp ET
Revenue Intelligence Report • 66 quarters of SEC filing data • Updated 2026-03-15
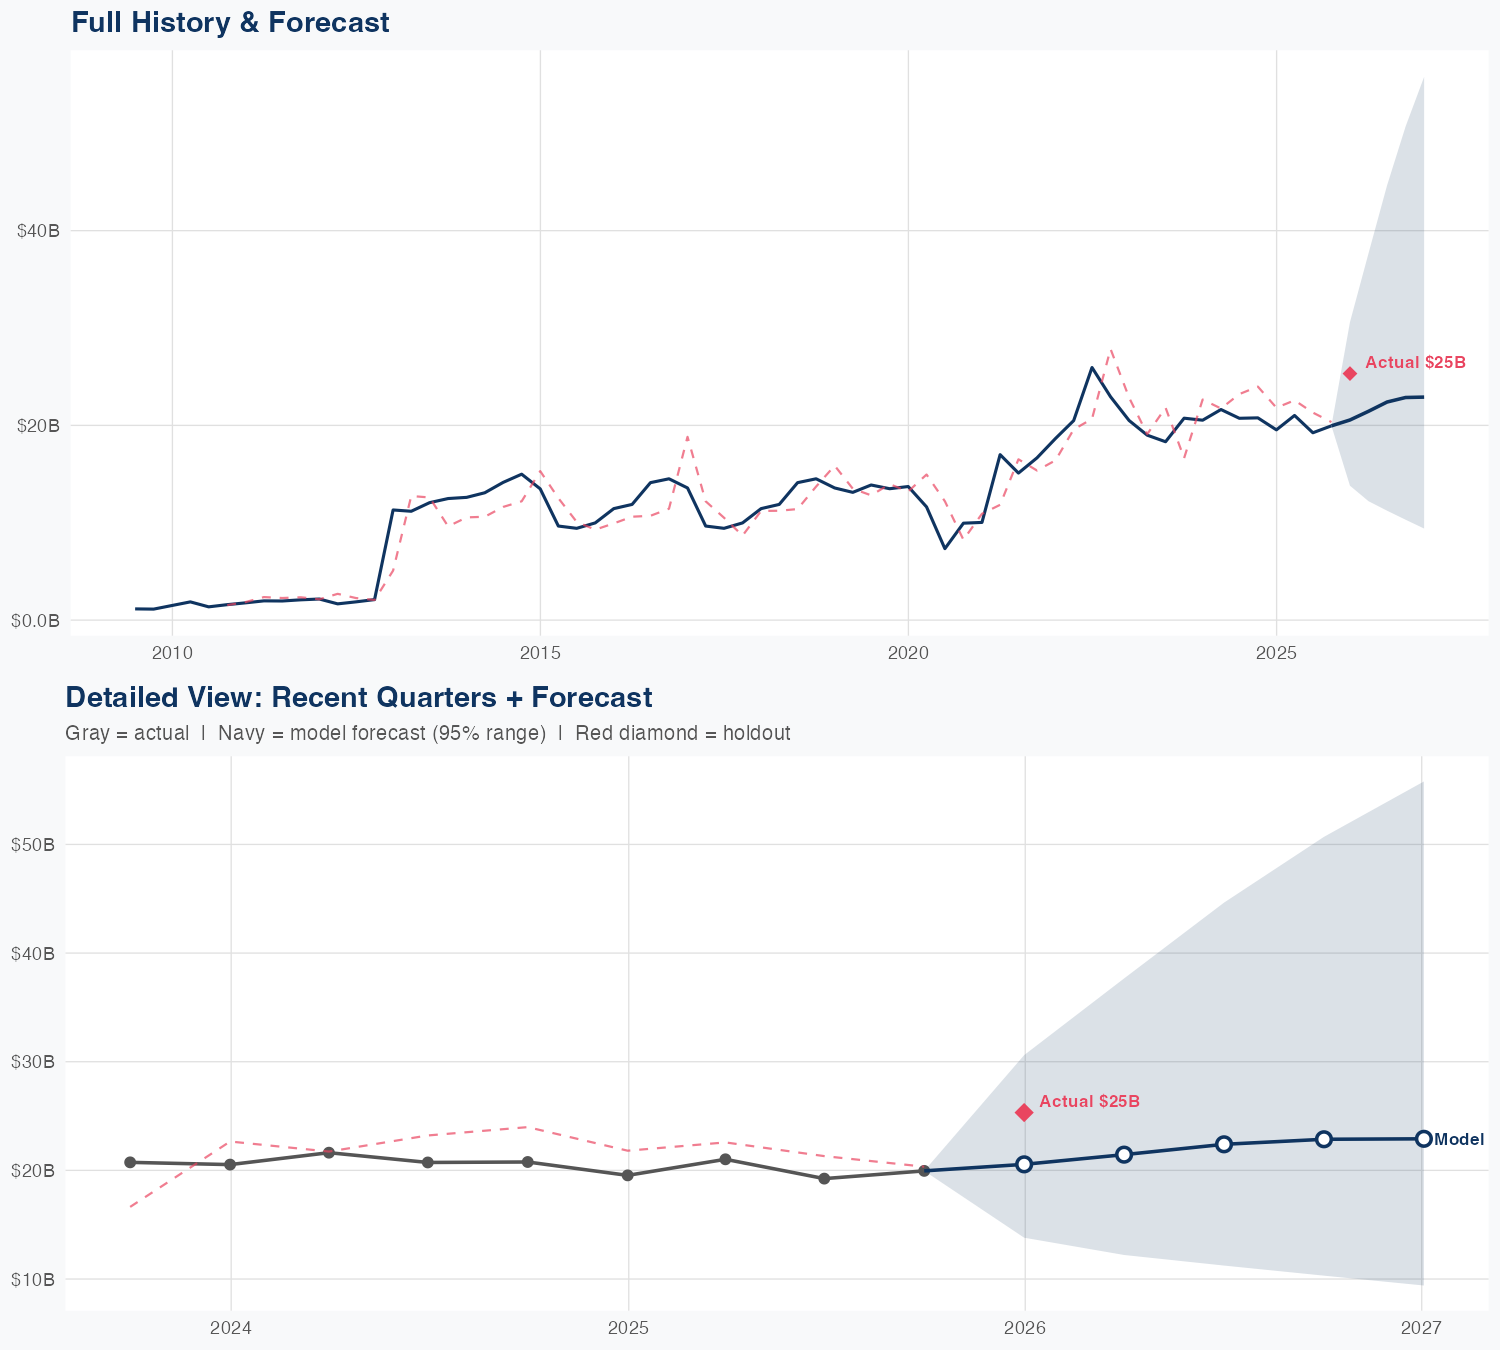
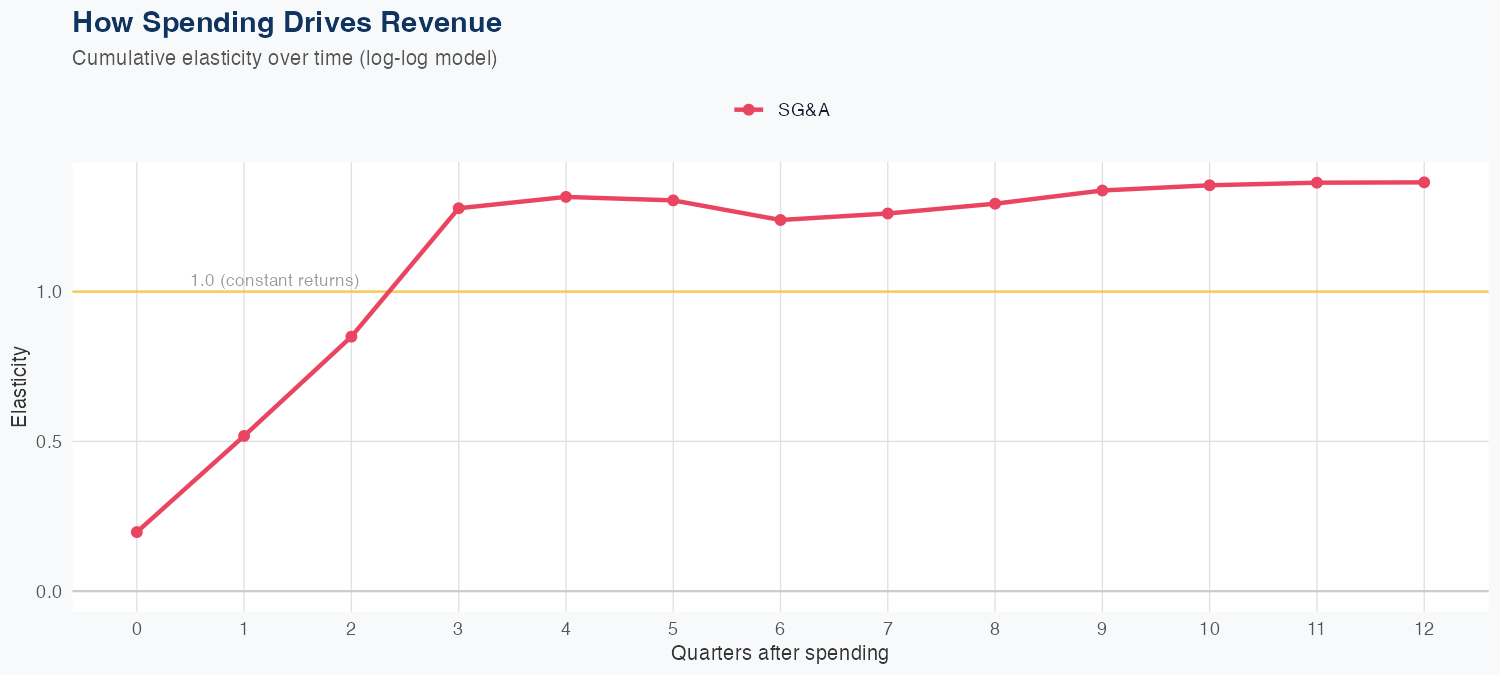
Energy Transfer posted FY revenue of $90 billion, up 4.8% YoY. In our econometric model, SG&A elasticity is 1.36x, implying growth is driven more by SG&A spending—expansion and commercial investments—than by price or volume alone. The holdout underpredicted by about 18.8% (predicted $20.6B vs actual $25.3B), and with a 15.4% MAPE, that gap signals limited forecast reliability; the model misses drivers like project timing and throughput mix. With a high SG&A elasticity, margins could be at risk if investments don’t translate into proportional throughput growth or tariff-based revenue. The growth-rate trajectory therefore exposes execution, capital allocation, and regulatory risk—delays on asset additions or higher financing costs could cap upside even as the core fee-based model remains steadier.
Investment Thesis
At 15.4% MAPE, the model captures Energy Transfer Lp's broad revenue trajectory, though quarterly variability suggests sensitivity to external factors. Sales & marketing spend shows a 1.36x elasticity, suggesting effective go-to-market execution.
Revenue Forecast
Quarterly Detail
| Quarter | Model Forecast | Actual | 95% Range | YoY Growth | Status |
|---|---|---|---|---|---|
| Q4 2025 | $21B | $25B | $14B – $31B | +5.2% | ✓ In range |
| Q2 2026 | $21B | $12B – $38B | +2.0% | ||
| Q3 2026 | $22B | $11B – $45B | +16.4% | ||
| Q4 2026 | $23B | $10B – $51B | +14.6% | ||
| Q1 2027 | $23B | $9.4B – $56B | -9.5% |
Seasonal Factors
| Fiscal Quarter | Seasonal Factor | vs Trend | Interpretation | Obs. |
|---|---|---|---|---|
| FQ1 (Sep–Nov) | 1.0745 | +7.4% | +7.4% above trend | 16 |
| FQ2 (Dec–Feb) | 1.0126 | +1.3% | In line with trend | 16 |
| FQ3 (Mar–May) | 0.972 | -2.8% | In line with trend | 15 |
| FQ4 (Jun–Aug) | 0.9142 | -8.6% | -8.6% below trend | 15 |
How Spending Drives Revenue
Want this analysis for your portfolio?
I build custom revenue intelligence reports for investors and companies using SEC filing data, econometric modeling, and AI-powered insights.
Get in Touch