Expand Energy Corporation EXE
Revenue Intelligence Report • 70 quarters of SEC filing data • Updated 2026-03-15
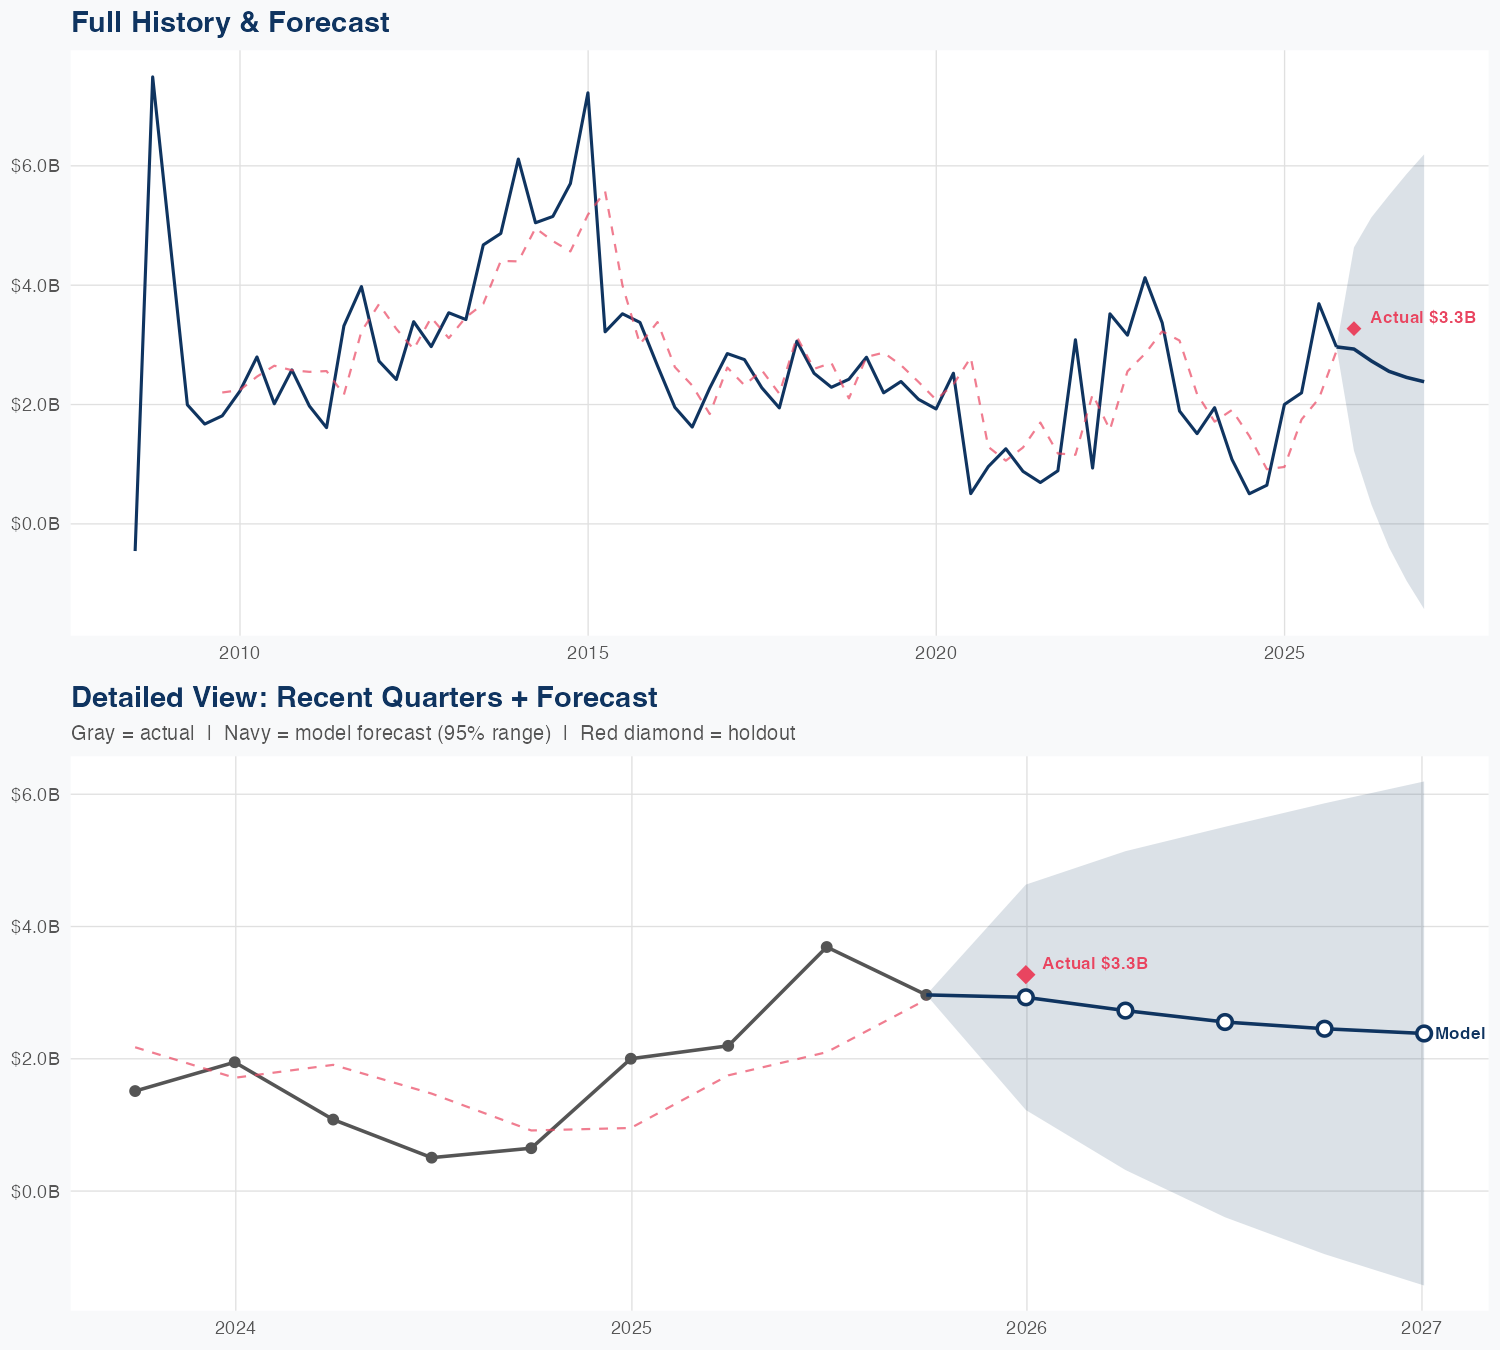
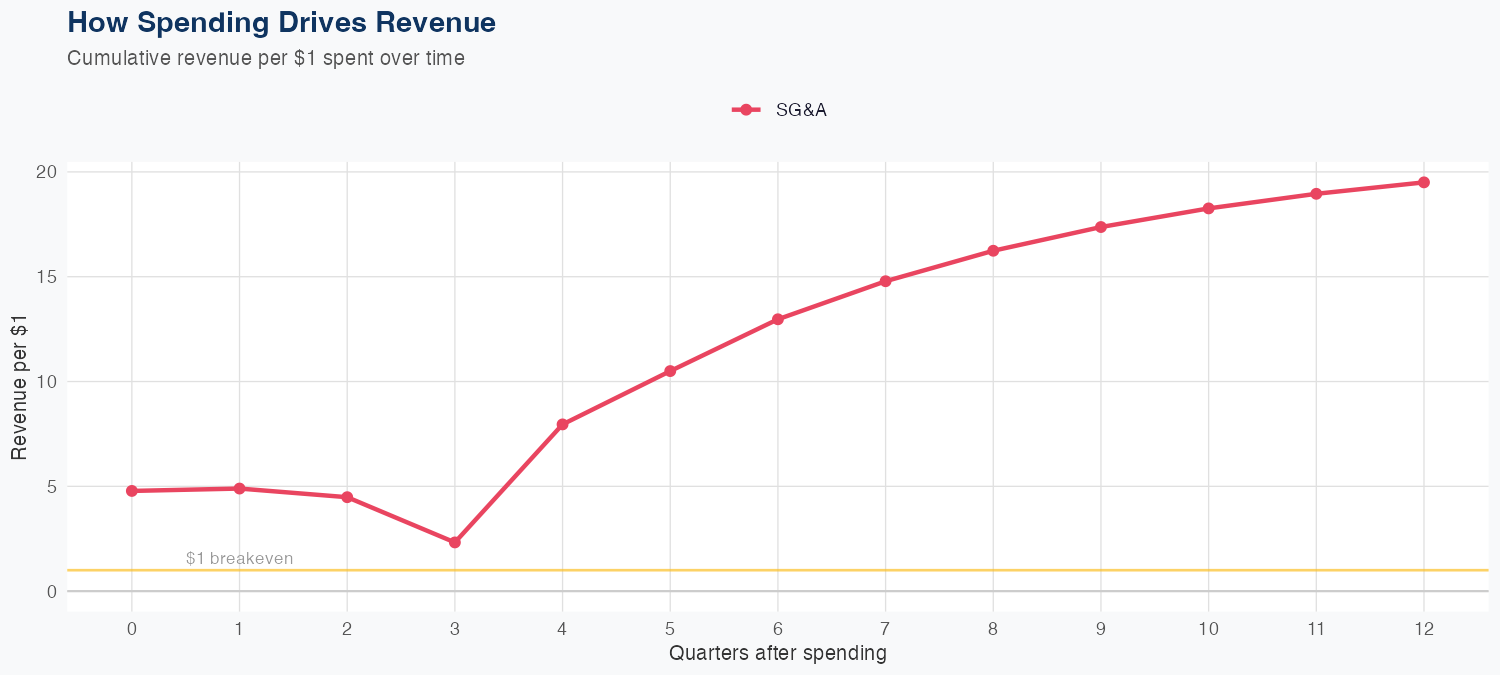
Revenue is driven by SG&A spending, which the model assumes generates $19.50 in long-run revenue for every $1 spent, indicating strong efficiency outside R&D. The linear model predicting quarterly revenue yields a MAPE of 36.4% and a holdout error of about 10.5%, suggesting limited predictive reliability despite the SG&A leverage. The latest quarter posted $3.272 billion in revenue, while the FY forecast is about $10 billion, implying a -16.5% year-over-year decline and weaker top-line momentum. Investors should weigh the attractive SG&A efficiency against the forecasted slowdown and model uncertainty when evaluating EXE’s outlook.
Investment Thesis
At 36.4% MAPE, the model captures Expand Energy Corporation's broad revenue trajectory, though quarterly variability suggests sensitivity to external factors. Each $1 of SG&A spending generates $19.50 in revenue, reflecting strong commercial efficiency.
Revenue Forecast
Quarterly Detail
| Quarter | Model Forecast | Actual | 95% Range | YoY Growth | Status |
|---|---|---|---|---|---|
| Q4 2025 | $2.9B | $3.3B | $1.2B – $4.6B | +46.4% | ✓ In range |
| Q2 2026 | $2.7B | $0.3B – $5.1B | +24.3% | ||
| Q3 2026 | $2.6B | $-0.4B – $5.5B | -30.7% | ||
| Q4 2026 | $2.5B | $-1.0B – $5.9B | -17.2% | ||
| Q1 2027 | $2.4B | $-1.4B – $6.2B | -27.2% |
Seasonal Factors
| Fiscal Quarter | Seasonal Factor | vs Trend | Interpretation | Obs. |
|---|---|---|---|---|
| FQ1 (Sep–Nov) | 1.0024 | +0.2% | In line with trend | 17 |
| FQ2 (Dec–Feb) | 1.1142 | +11.4% | +11.4% above trend | 17 |
| FQ3 (Mar–May) | 0.9717 | -2.8% | In line with trend | 16 |
| FQ4 (Jun–Aug) | 0.8858 | -11.4% | -11.4% below trend | 16 |
How Spending Drives Revenue
Want this analysis for your portfolio?
I build custom revenue intelligence reports for investors and companies using SEC filing data, econometric modeling, and AI-powered insights.
Get in Touch