First Citizens Bancshares Inc /De/ FCNCA
Revenue Intelligence Report • 66 quarters of SEC filing data • Updated 2026-03-15
Revenue is expected to grow about 15.6% year over year, taking FY revenue from $11.0 billion to roughly $12.7 billion as the bank benefits from a broad structural/platform lift and ongoing SG&A-driven expansion. The binding constraint on growth appears to be regulatory capital headroom and balance-sheet capacity to support higher lending, which could cap topline upside even as SG&A spending remains effective. Our econometric model shows elasticities are high and rising, with current growth attribution around 19% structural/platform and 81% from SG&A, implying incremental SG&A investment is the primary growth lever. Key risk: a slower-than-expected loan demand environment or a material uptick in credit losses could throttle revenue, especially if regulatory capital headroom narrows.
Investment Thesis
At 13.0% MAPE, the model captures First Citizens Bancshares Inc /De/'s broad revenue trajectory, though quarterly variability suggests sensitivity to external factors. Sales & marketing spend shows a 1.29x elasticity, suggesting effective go-to-market execution.
Revenue Forecast
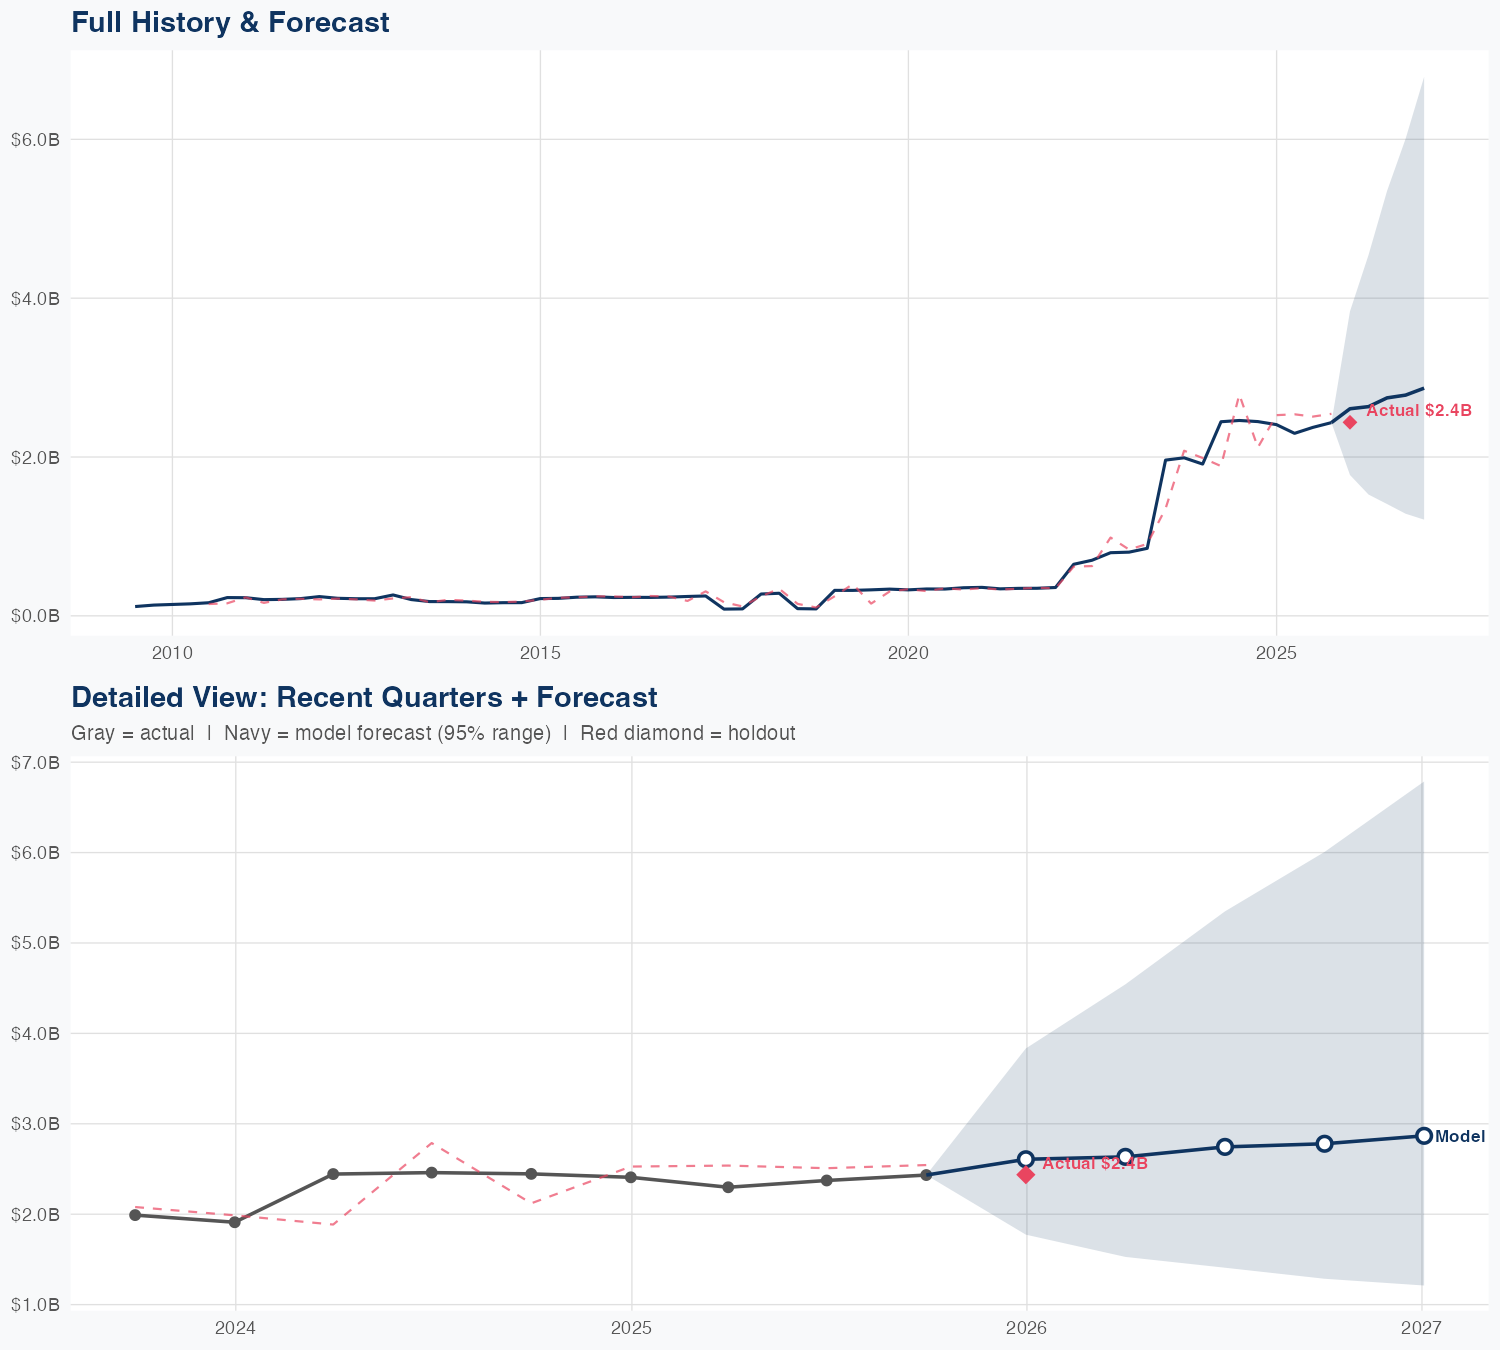
Quarterly Detail
| Quarter | Model Forecast | Actual | 95% Range | YoY Growth | Status |
|---|---|---|---|---|---|
| Q4 2025 | $2.6B | $2.4B | $1.8B – $3.8B | +8.3% | ✓ In range |
| Q2 2026 | $2.6B | $1.5B – $4.5B | +14.6% | ||
| Q3 2026 | $2.7B | $1.4B – $5.3B | +15.7% | ||
| Q4 2026 | $2.8B | $1.3B – $6.0B | +14.2% | ||
| Q1 2027 | $2.9B | $1.2B – $6.8B | +17.6% |
Seasonal Factors
| Fiscal Quarter | Seasonal Factor | vs Trend | Interpretation | Obs. |
|---|---|---|---|---|
| FQ1 (Sep–Nov) | 0.9755 | -2.5% | In line with trend | 16 |
| FQ2 (Dec–Feb) | 1.0292 | +2.9% | In line with trend | 16 |
| FQ3 (Mar–May) | 0.9675 | -3.3% | -3.3% below trend | 15 |
| FQ4 (Jun–Aug) | 1.0063 | +0.6% | In line with trend | 16 |
How Spending Drives Revenue
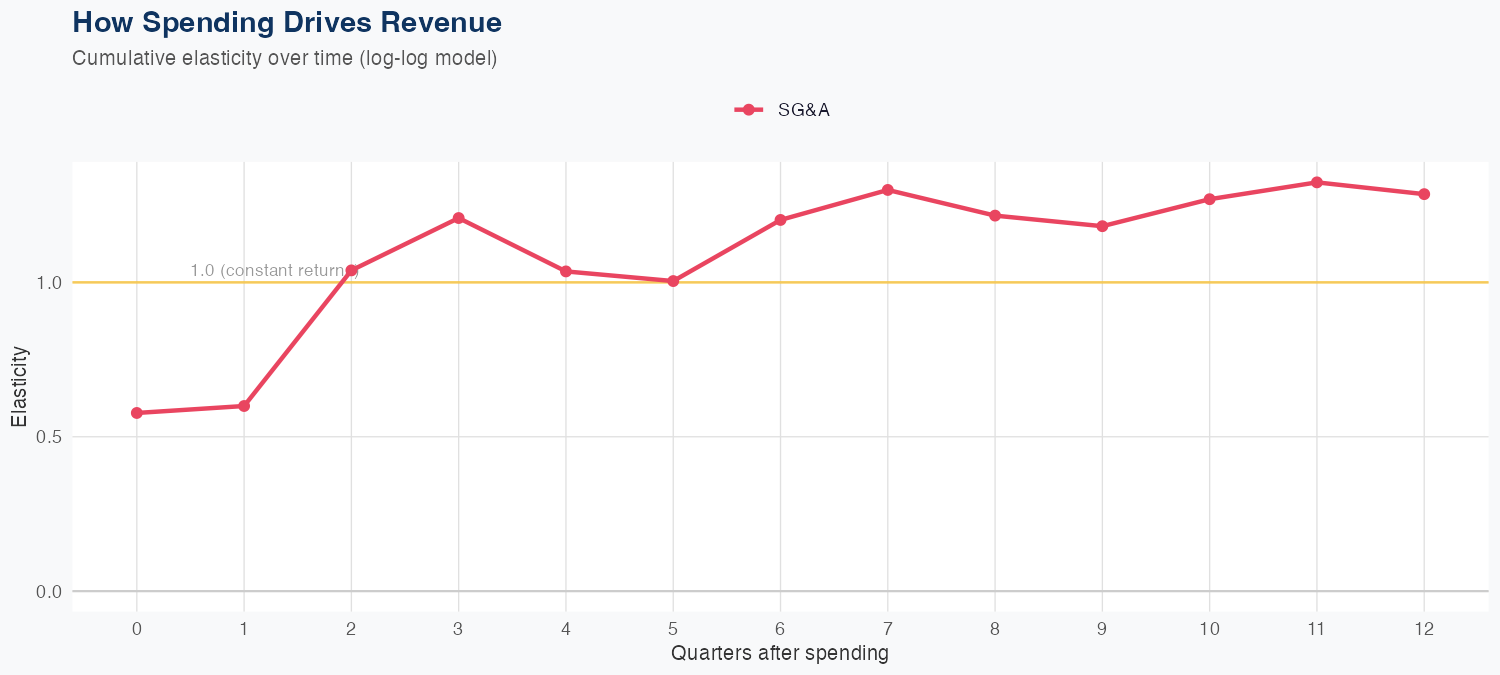
Spending Efficiency Over Time
Current SG&A elasticity: 0.923x
Want this analysis for your portfolio?
I build custom revenue intelligence reports for investors and companies using SEC filing data, econometric modeling, and AI-powered insights.
Get in Touch