Fedex Corporation FDX
Revenue Intelligence Report • 53 quarters of SEC filing data • Updated 2026-03-15
Revenue is forecast to grow about 3.2% year over year, supported by structural/platform growth and selective SG&A investments that add incremental lift. Our econometric model indicates the binding constraint on further revenue expansion is network delivery capacity rather than spend. Elasticities appear modest and structural growth is meaningful, so platform scale and pricing power are the main engines while SG&A acts more as maintenance. The SG&A multiplier has fallen from roughly 1.53 to 0.61 across the sample, underscoring rising operating leverage and the shift toward non-spend drivers of growth. Key risk to the outlook is sustained capacity constraints—delivery and hub throughput—during peak periods or in supply-chain shocks, which could cap upside beyond the 3% baseline.
Investment Thesis
Our ARDL model tracks Fedex Corporation's revenue with exceptional precision (1.2% MAPE), indicating highly predictable cash flows. Each $1 of SG&A spending generates $2.98 in revenue, reflecting strong commercial efficiency.
Revenue Forecast
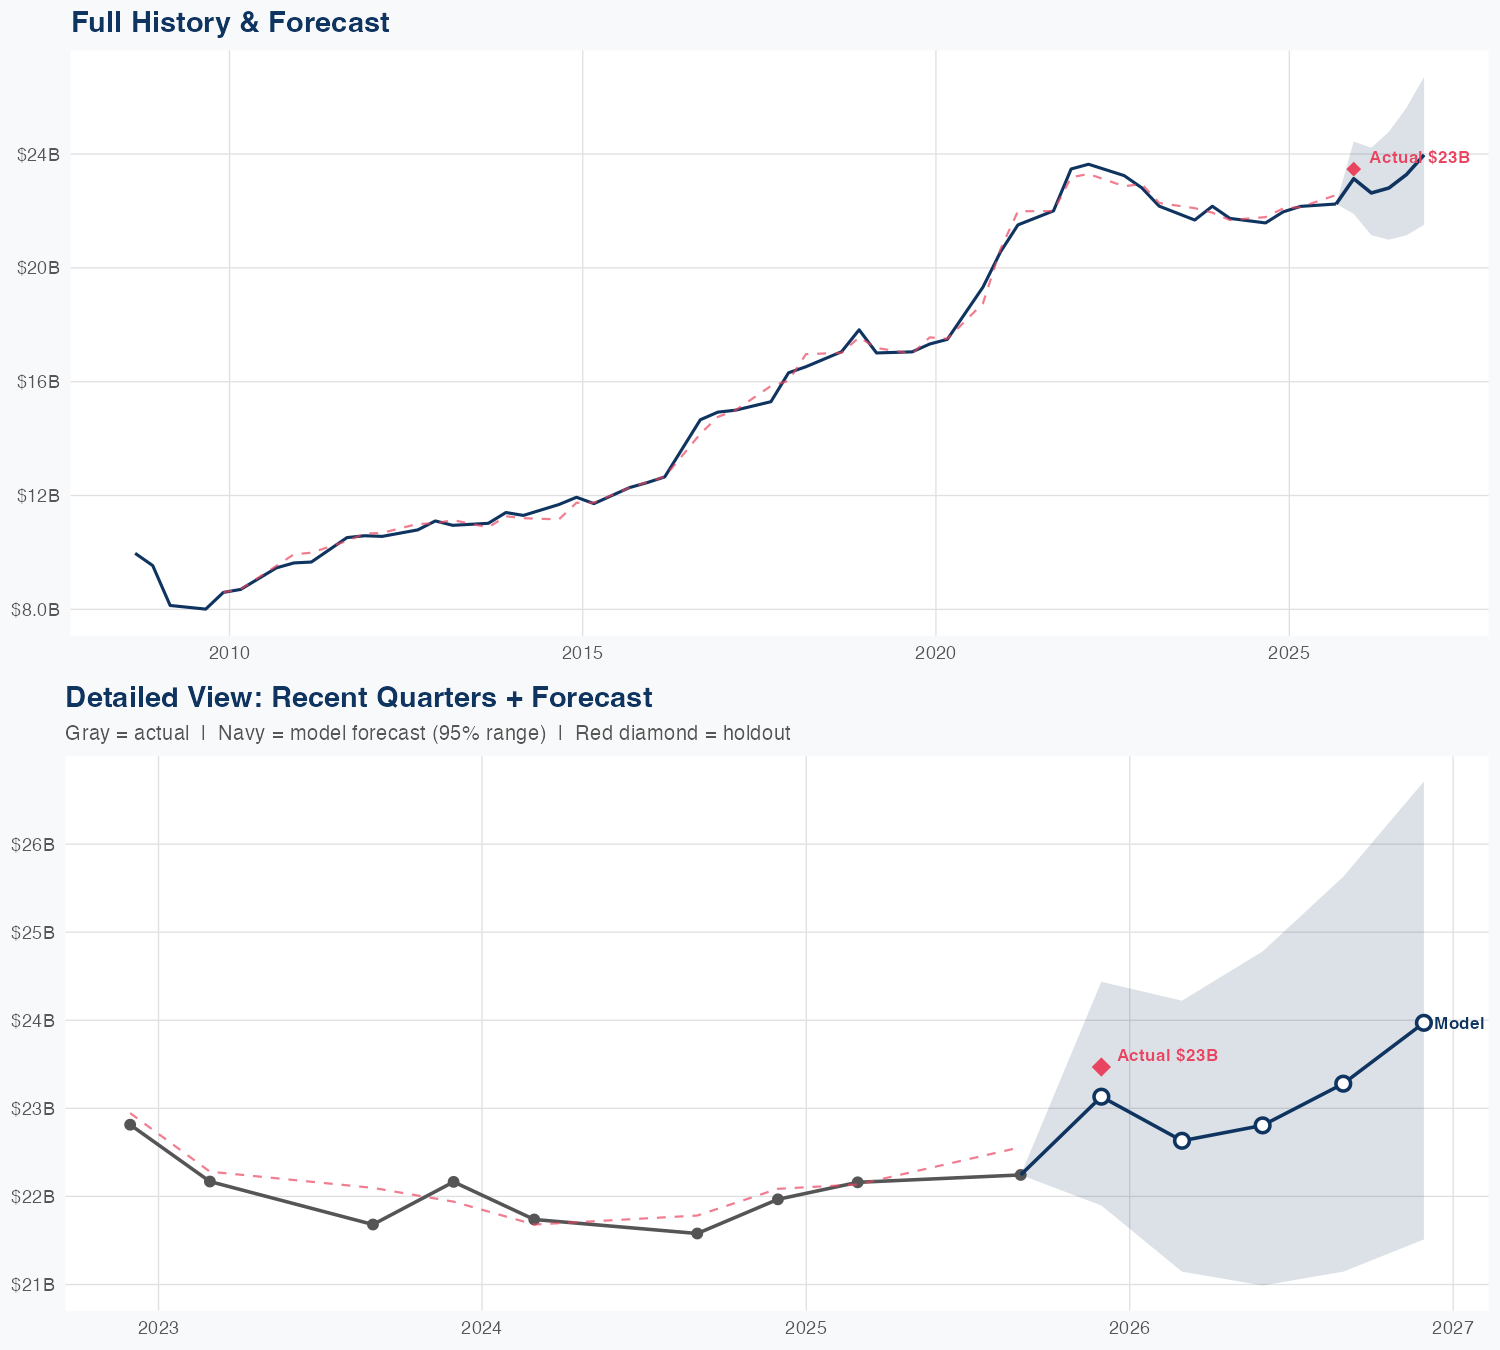
Quarterly Detail
| Quarter | Model Forecast | Actual | 95% Range | YoY Growth | Status |
|---|---|---|---|---|---|
| Q4 2025 | $23B | $23B | $22B – $24B | +7.2% | ✓ In range |
| Q1 2026 | $23B | $21B – $24B | +3.0% | ||
| Q2 2026 | $23B | $21B – $25B | +2.9% | ||
| Q3 2026 | $23B | $21B – $26B | +4.7% | ||
| Q4 2026 | $24B | $22B – $27B | +2.1% |
Seasonal Factors
| Fiscal Quarter | Seasonal Factor | vs Trend | Interpretation | Obs. |
|---|---|---|---|---|
| FQ1 (Sep–Nov) | 1.0065 | +0.7% | In line with trend | 17 |
| FQ2 (Dec–Feb) | 0.9989 | -0.1% | In line with trend | 16 |
| FQ3 (Mar–May) | 1.0 | +0.0% | In line with trend | 0 |
| FQ4 (Jun–Aug) | 1.0023 | +0.2% | In line with trend | 16 |
How Spending Drives Revenue
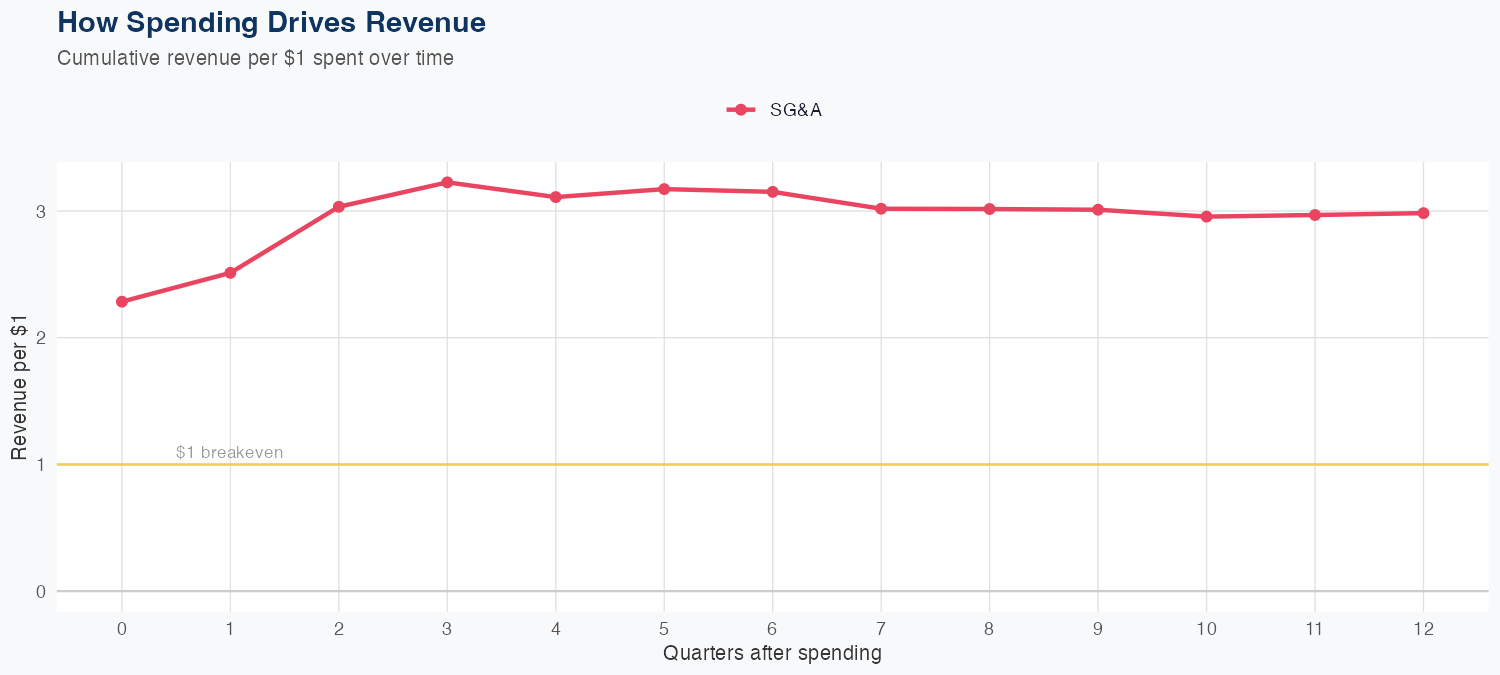
Spending Efficiency Over Time
Current SG&A multiplier: 0.613
Want this analysis for your portfolio?
I build custom revenue intelligence reports for investors and companies using SEC filing data, econometric modeling, and AI-powered insights.
Get in Touch