Firstenergy Corp. FE
Revenue Intelligence Report • 9 quarters of SEC filing data • Updated 2026-03-16
Our FY revenue is projected to decline about 14% year over year to roughly $9.7 billion. According to our econometric model, revenue growth is heavily reliant on SG&A investment (about 65% of the growth), with structural/platform growth at about 35% and R&D contributing virtually nothing. The binding constraint appears to be regulatory approvals and rate actions that cap how much revenue FE can book for a given level of spend. Encouragingly, the SG&A efficiency is improving—the SG&A revenue multiplier has risen toward 0.63, implying incremental SG&A spend is translating into outsized topline gains. Key risk: a delay or unfavorable outcome in rate cases or regulatory approvals could throttle revenue upside and extend the annual decline.
Investment Thesis
The econometric model achieves strong accuracy (4.4% MAPE), suggesting Firstenergy Corp.'s revenue trajectory is well-characterized by its spending patterns. Each $1 of SG&A spending generates $1.77 in revenue, reflecting strong commercial efficiency.
Revenue Forecast
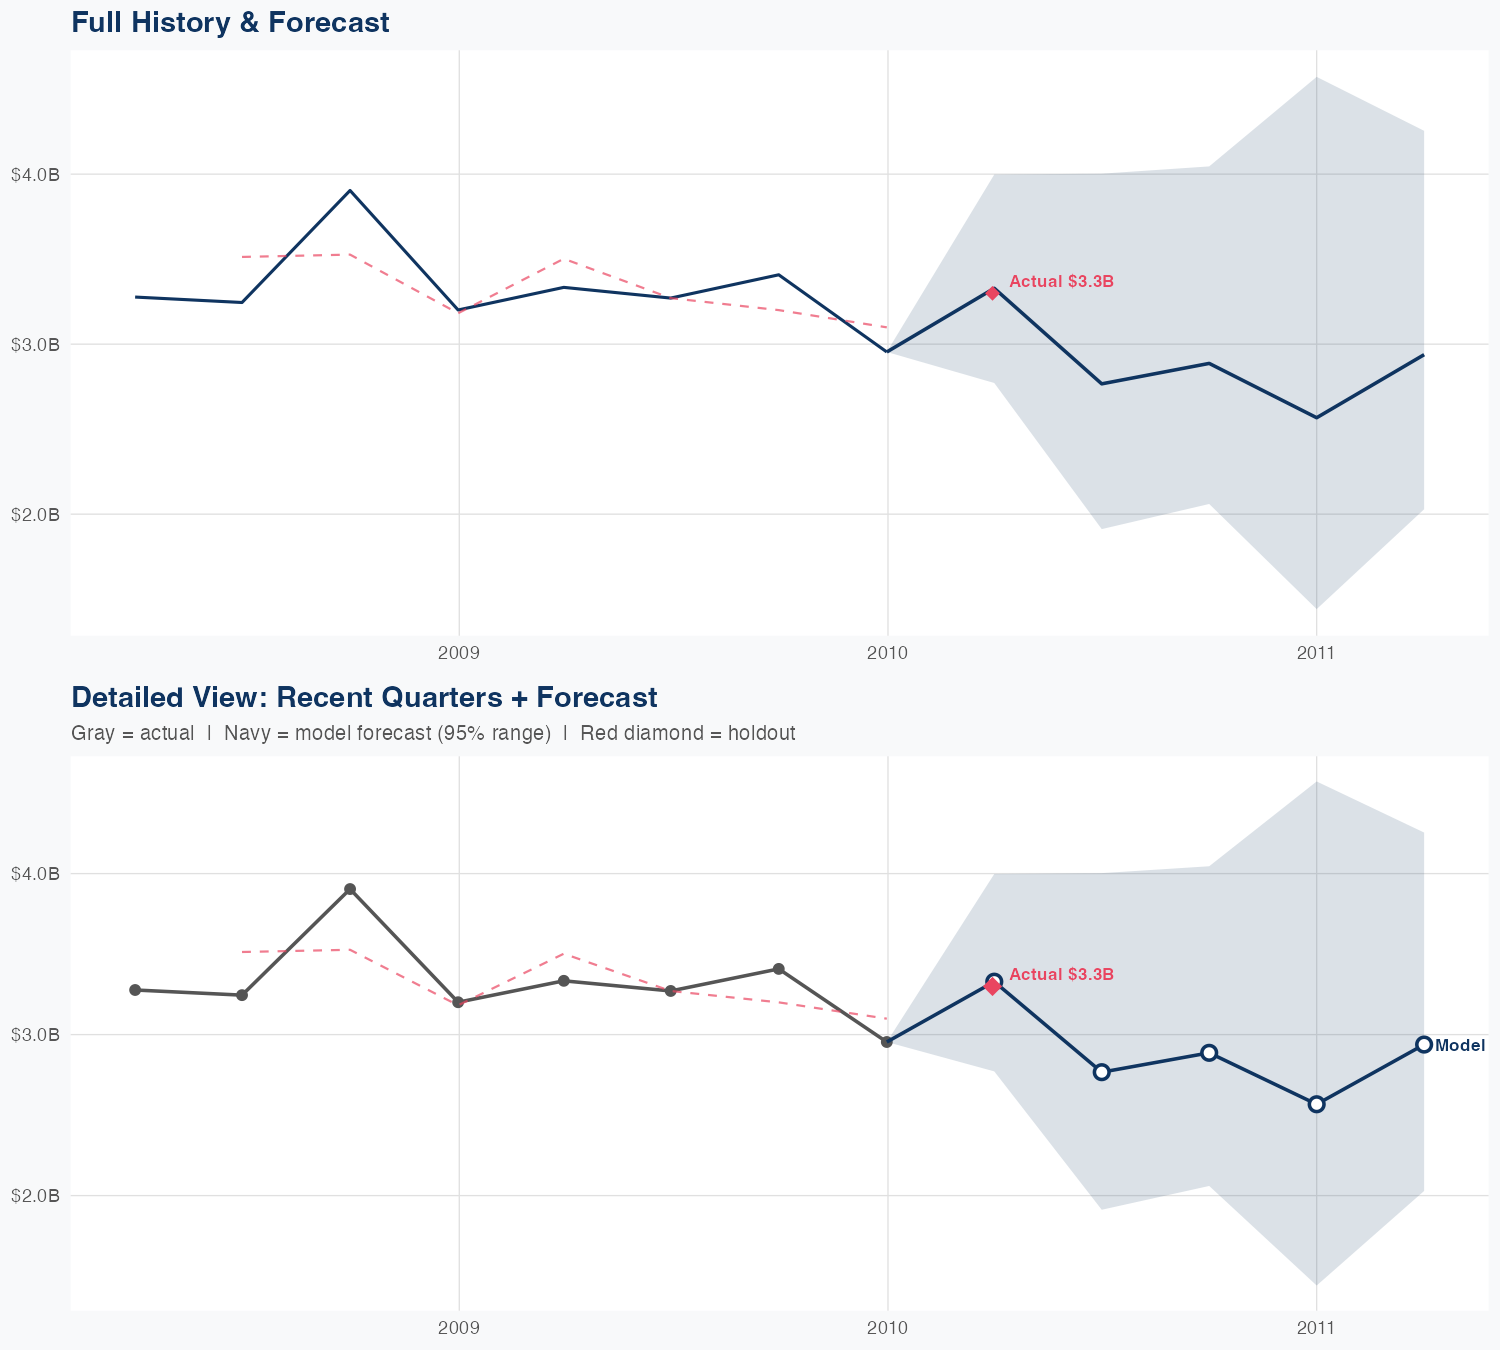
Quarterly Detail
| Quarter | Model Forecast | Actual | 95% Range | YoY Growth | Status |
|---|---|---|---|---|---|
| Q2 2010 | $3.3B | $3.3B | $2.8B – $4.0B | -0.2% | ✓ In range |
| Q3 2010 | $2.8B | $1.9B – $4.0B | -15.4% | ||
| Q4 2010 | $2.9B | $2.1B – $4.0B | -15.3% | ||
| Q1 2011 | $2.6B | $1.4B – $4.6B | -13.1% | ||
| Q2 2011 | $2.9B | $2.0B – $4.3B | -10.9% |
How Spending Drives Revenue
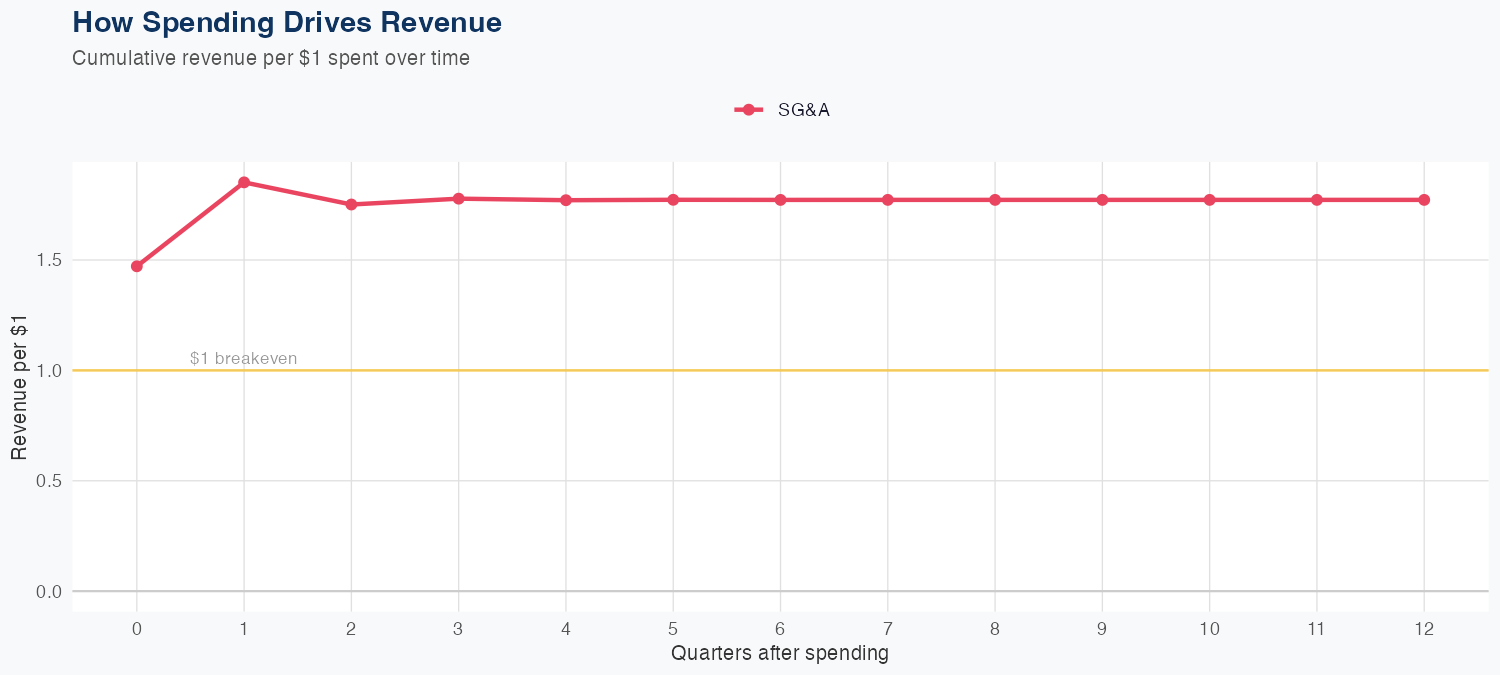
Spending Efficiency Over Time
Current SG&A multiplier: 0.6279
Want this analysis for your portfolio?
I build custom revenue intelligence reports for investors and companies using SEC filing data, econometric modeling, and AI-powered insights.
Get in Touch