Fifth Third Bancorp FITB
Revenue Intelligence Report • 70 quarters of SEC filing data • Updated 2026-03-15
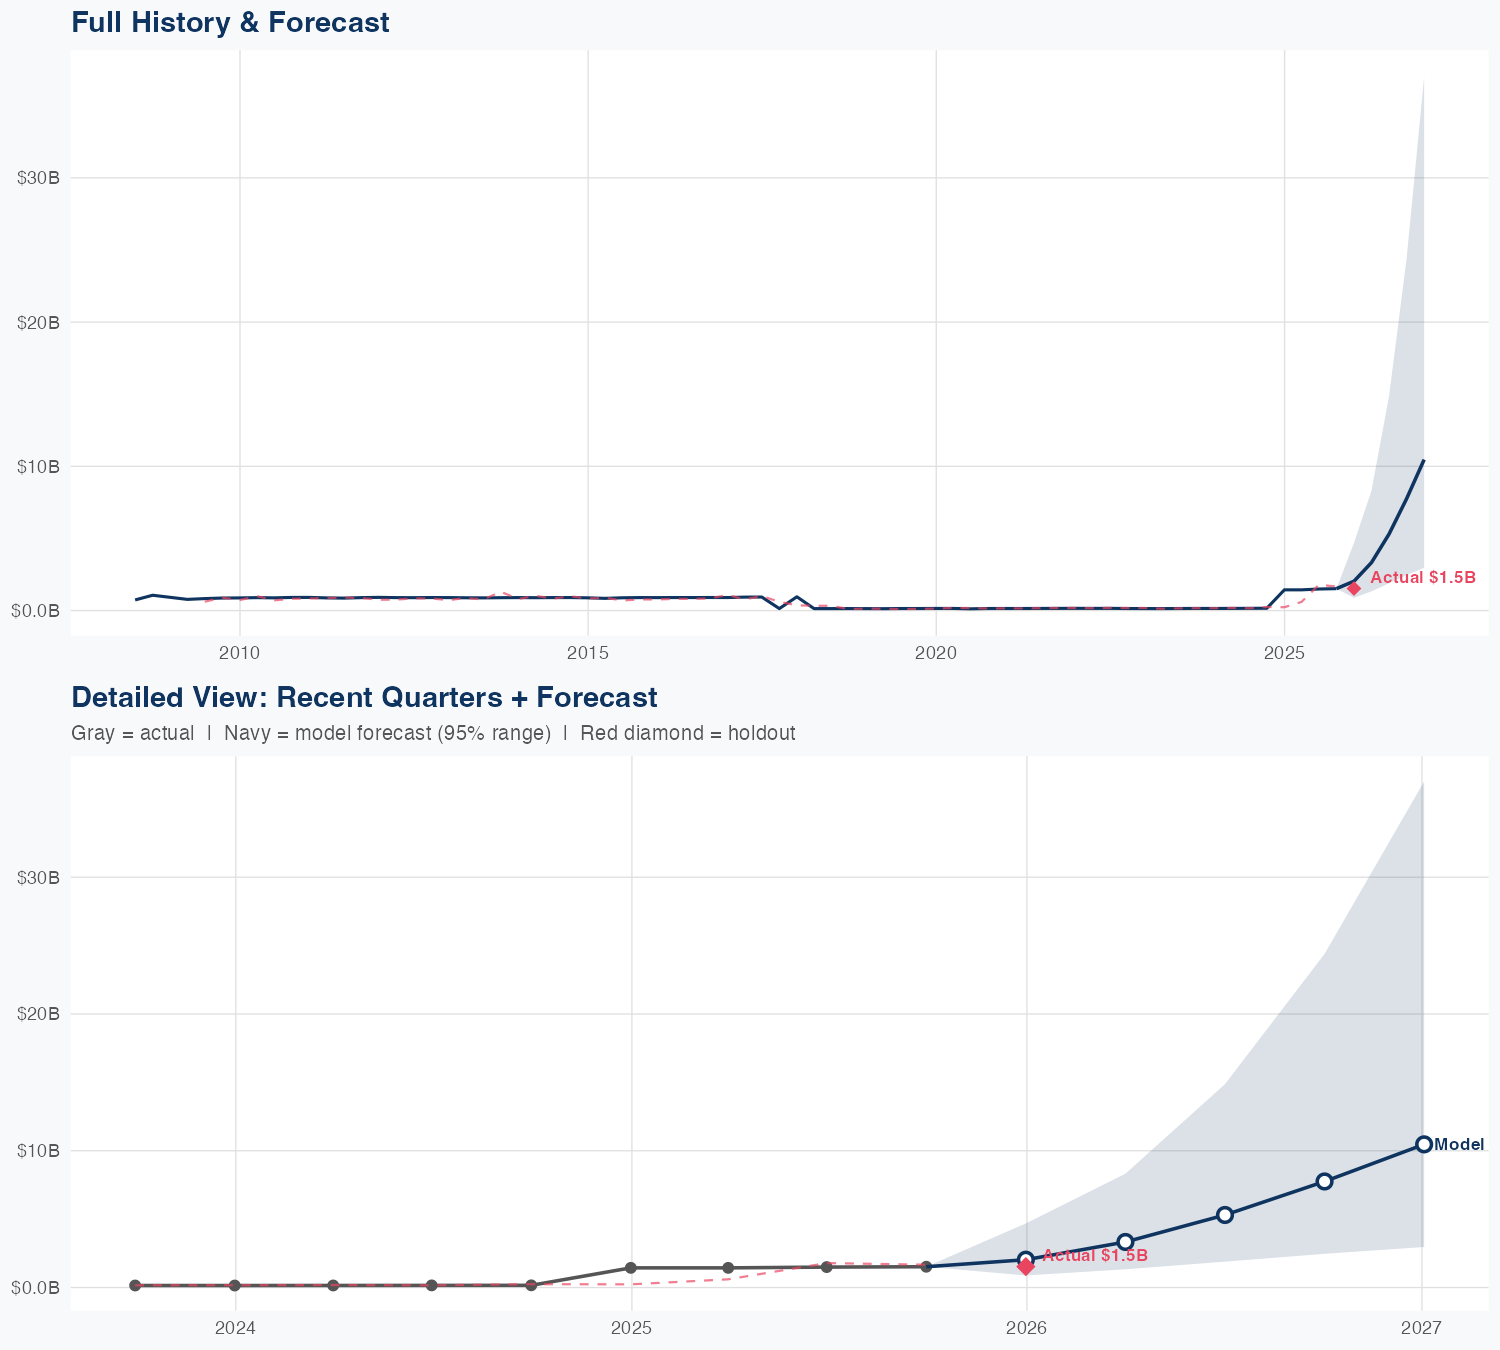
Revenue is expected to grow strongly, up roughly 350% year over year, with the trajectory continuing higher as Fifth Third scales its structural and platform-driven revenue streams. Binding constraint: balance-sheet capacity to fund additional lending—capital adequacy and risk-weighted asset limits (plus deposit funding) cap further revenue expansion. Our econometric model shows SG&A elasticity has declined and even turned negative as operating leverage improves, meaning growth is driven more by platform scale and pricing power than by incremental spending; current attribution assigns about 37% of growth to structural/platform factors and 63% to SG&A investments, though the holdout forecast was about 33% below actual. Key risk: a slower-than-expected loan-demand environment or tighter regulatory capital requirements could throttle revenue growth and platform monetization.
Investment Thesis
At 25.5% MAPE, the model captures Fifth Third Bancorp's broad revenue trajectory, though quarterly variability suggests sensitivity to external factors. Sales & marketing spend shows a 5.07x elasticity, suggesting effective go-to-market execution.
Revenue Forecast
Quarterly Detail
| Quarter | Model Forecast | Actual | 95% Range | YoY Growth | Status |
|---|---|---|---|---|---|
| Q4 2025 | $2.0B | $1.5B | $0.9B – $4.7B | +41.5% | ✓ In range |
| Q2 2026 | $3.3B | $1.3B – $8.3B | +131.8% | ||
| Q3 2026 | $5.3B | $1.9B – $15B | +254.8% | ||
| Q4 2026 | $7.8B | $2.5B – $24B | +410.2% | ||
| Q1 2027 | $10B | $3.0B – $37B | +584.2% |
Seasonal Factors
| Fiscal Quarter | Seasonal Factor | vs Trend | Interpretation | Obs. |
|---|---|---|---|---|
| FQ1 (Sep–Nov) | 0.9718 | -2.8% | In line with trend | 17 |
| FQ2 (Dec–Feb) | 1.0684 | +6.8% | +6.8% above trend | 17 |
| FQ3 (Mar–May) | 1.0182 | +1.8% | In line with trend | 16 |
| FQ4 (Jun–Aug) | 0.9667 | -3.3% | -3.3% below trend | 17 |
How Spending Drives Revenue
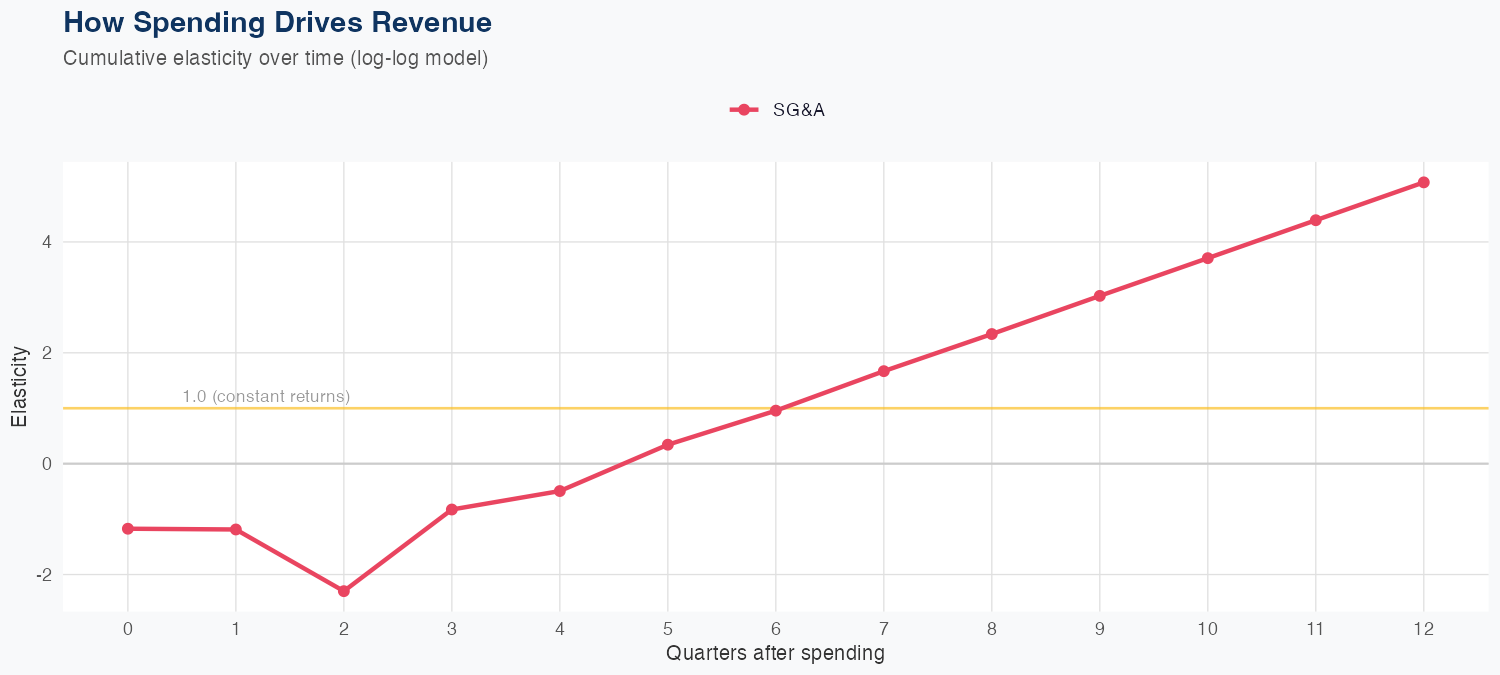
Spending Efficiency Over Time
Current SG&A elasticity: -2.5269x
Want this analysis for your portfolio?
I build custom revenue intelligence reports for investors and companies using SEC filing data, econometric modeling, and AI-powered insights.
Get in Touch