Fabrinet FN
Revenue Intelligence Report • 47 quarters of SEC filing data • Updated 2026-03-15
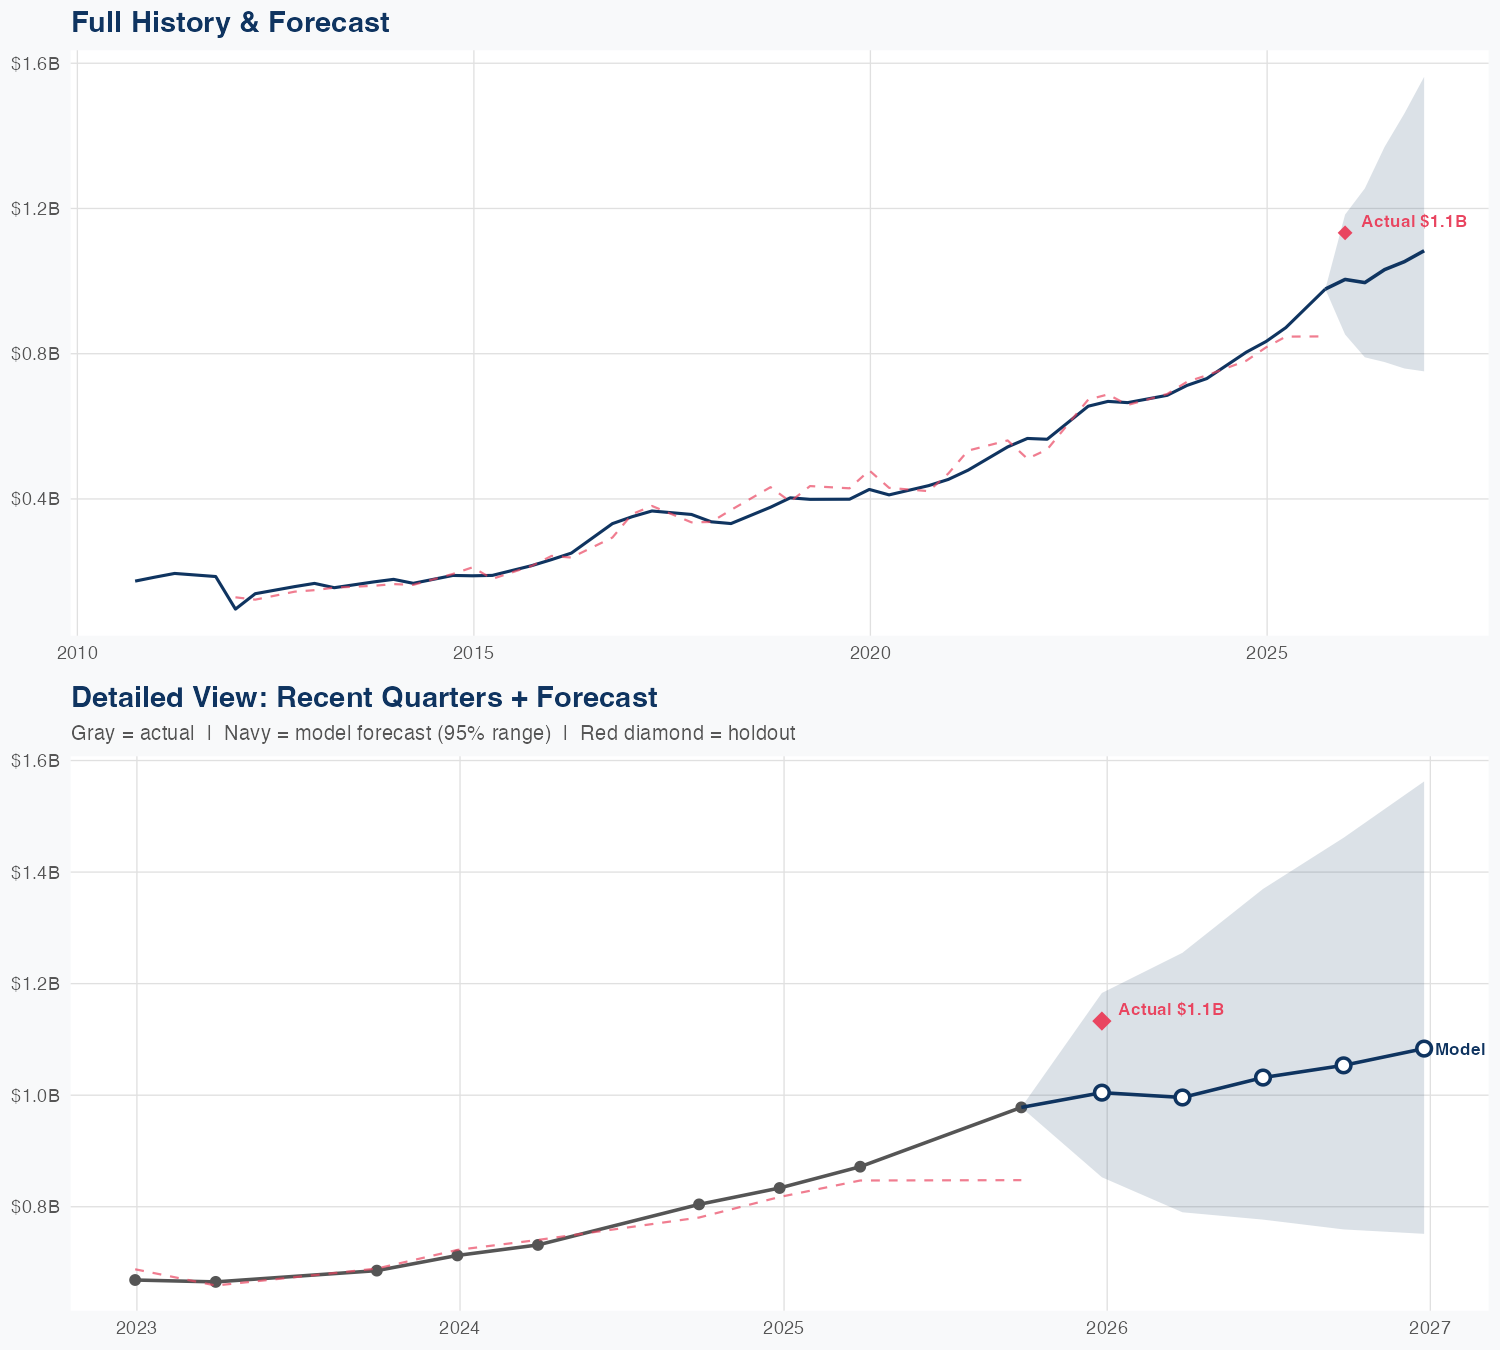
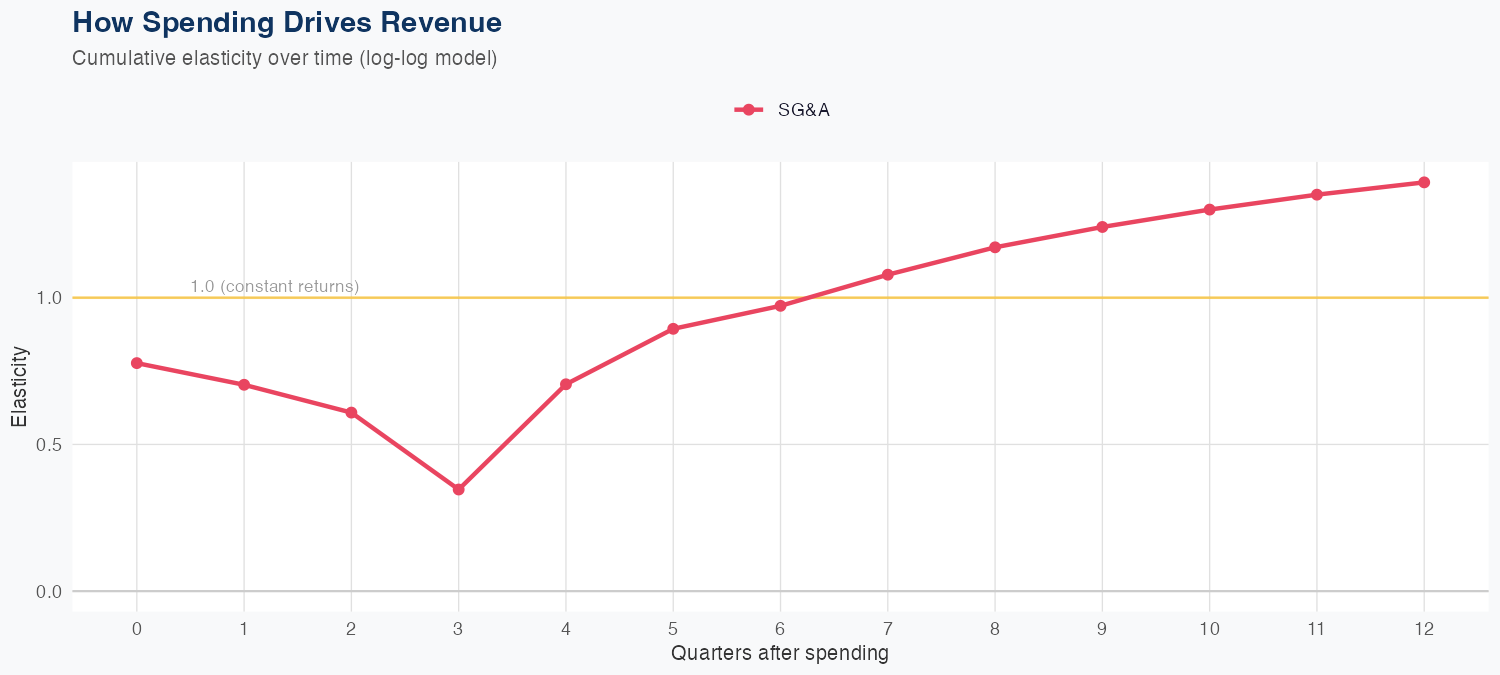
Latest quarter revenue is $1.13 billion, informed by 47 quarters of history used to fit a log-log model. Revenue is driven by SG&A with an elasticity of 1.39, so a 1% increase in SG&A is linked to a 1.39% rise in revenue, implying a favorable ROI on SG&A investments under current dynamics. Model results show modest accuracy (MAPE 6.4%), with a holdout error of 11.3% (predicted $1.0B vs actual $1.1B), indicating forecasting risk. The FY forecast calls for $4.2B in revenue, about +9.1% year over year, signaling solid growth prospects contingent on maintaining SG&A-driven revenue momentum and the model’s assumptions.
Investment Thesis
The econometric model achieves strong accuracy (6.4% MAPE), suggesting Fabrinet's revenue trajectory is well-characterized by its spending patterns. Sales & marketing spend shows a 1.39x elasticity, suggesting effective go-to-market execution.
Revenue Forecast
Quarterly Detail
| Quarter | Model Forecast | Actual | 95% Range | YoY Growth | Status |
|---|---|---|---|---|---|
| Q4 2025 | $1.0B | $1.1B | $0.9B – $1.2B | +24.9% | ✓ In range |
| Q1 2026 | $1.0B | $0.8B – $1.3B | +19.5% | ||
| Q2 2026 | $1.0B | $0.8B – $1.4B | +18.3% | ||
| Q3 2026 | $1.1B | $0.8B – $1.5B | +7.7% | ||
| Q4 2026 | $1.1B | $0.8B – $1.6B | -4.4% |
Seasonal Factors
| Fiscal Quarter | Seasonal Factor | vs Trend | Interpretation | Obs. |
|---|---|---|---|---|
| FQ1 (Sep–Nov) | 1.0302 | +3.0% | +3.0% above trend | 14 |
| FQ2 (Dec–Feb) | 0.9863 | -1.4% | In line with trend | 15 |
| FQ3 (Mar–May) | 1.0099 | +1.0% | In line with trend | 14 |
| FQ4 (Jun–Aug) | 1.0 | +0.0% | In line with trend | 0 |
How Spending Drives Revenue
Want this analysis for your portfolio?
I build custom revenue intelligence reports for investors and companies using SEC filing data, econometric modeling, and AI-powered insights.
Get in Touch