Loews Corporation L
Revenue Intelligence Report • 70 quarters of SEC filing data • Updated 2026-03-15
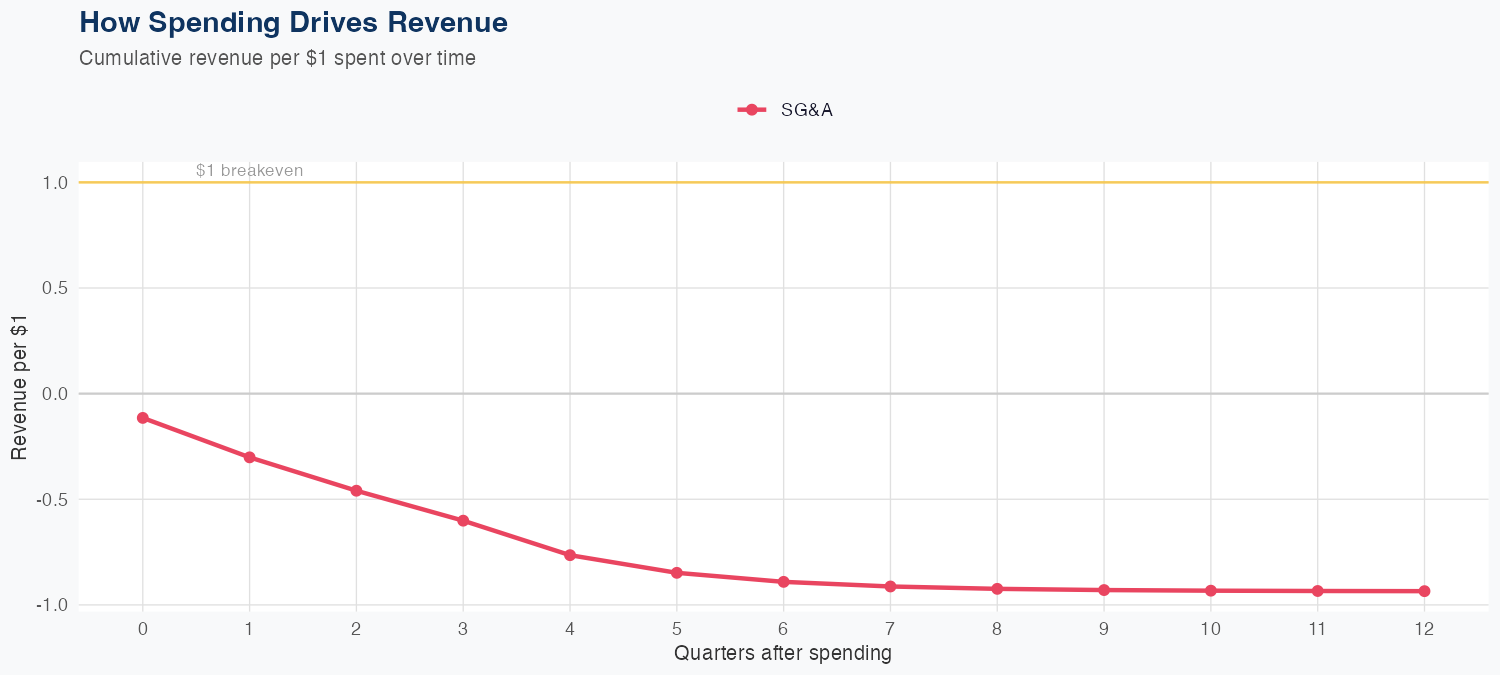
Revenue is expected to grow about 2.7% this year, to roughly $19.5 billion. That modest uptick reflects a stabilizing mix across the diversified portfolio and a gradual recovery in core lines, though cyclicality keeps the pace restrained. Our econometric model, a linear framework with fixed coefficients learned over 70 quarters, shows SG&A spend has a negative association with revenue (-0.93 revenue per $1), underscoring the need for disciplined cost management; it delivers an in-sample MAPE of 4.7% and a holdout error of about 4.3% (predicted $4.5B vs actual $4.7B). Key risk: macro-driven volatility in insurance pricing and hotel demand could derail the revenue trajectory.
Investment Thesis
The econometric model achieves strong accuracy (4.7% MAPE), suggesting Loews Corporation's revenue trajectory is well-characterized by its spending patterns.
Revenue Forecast
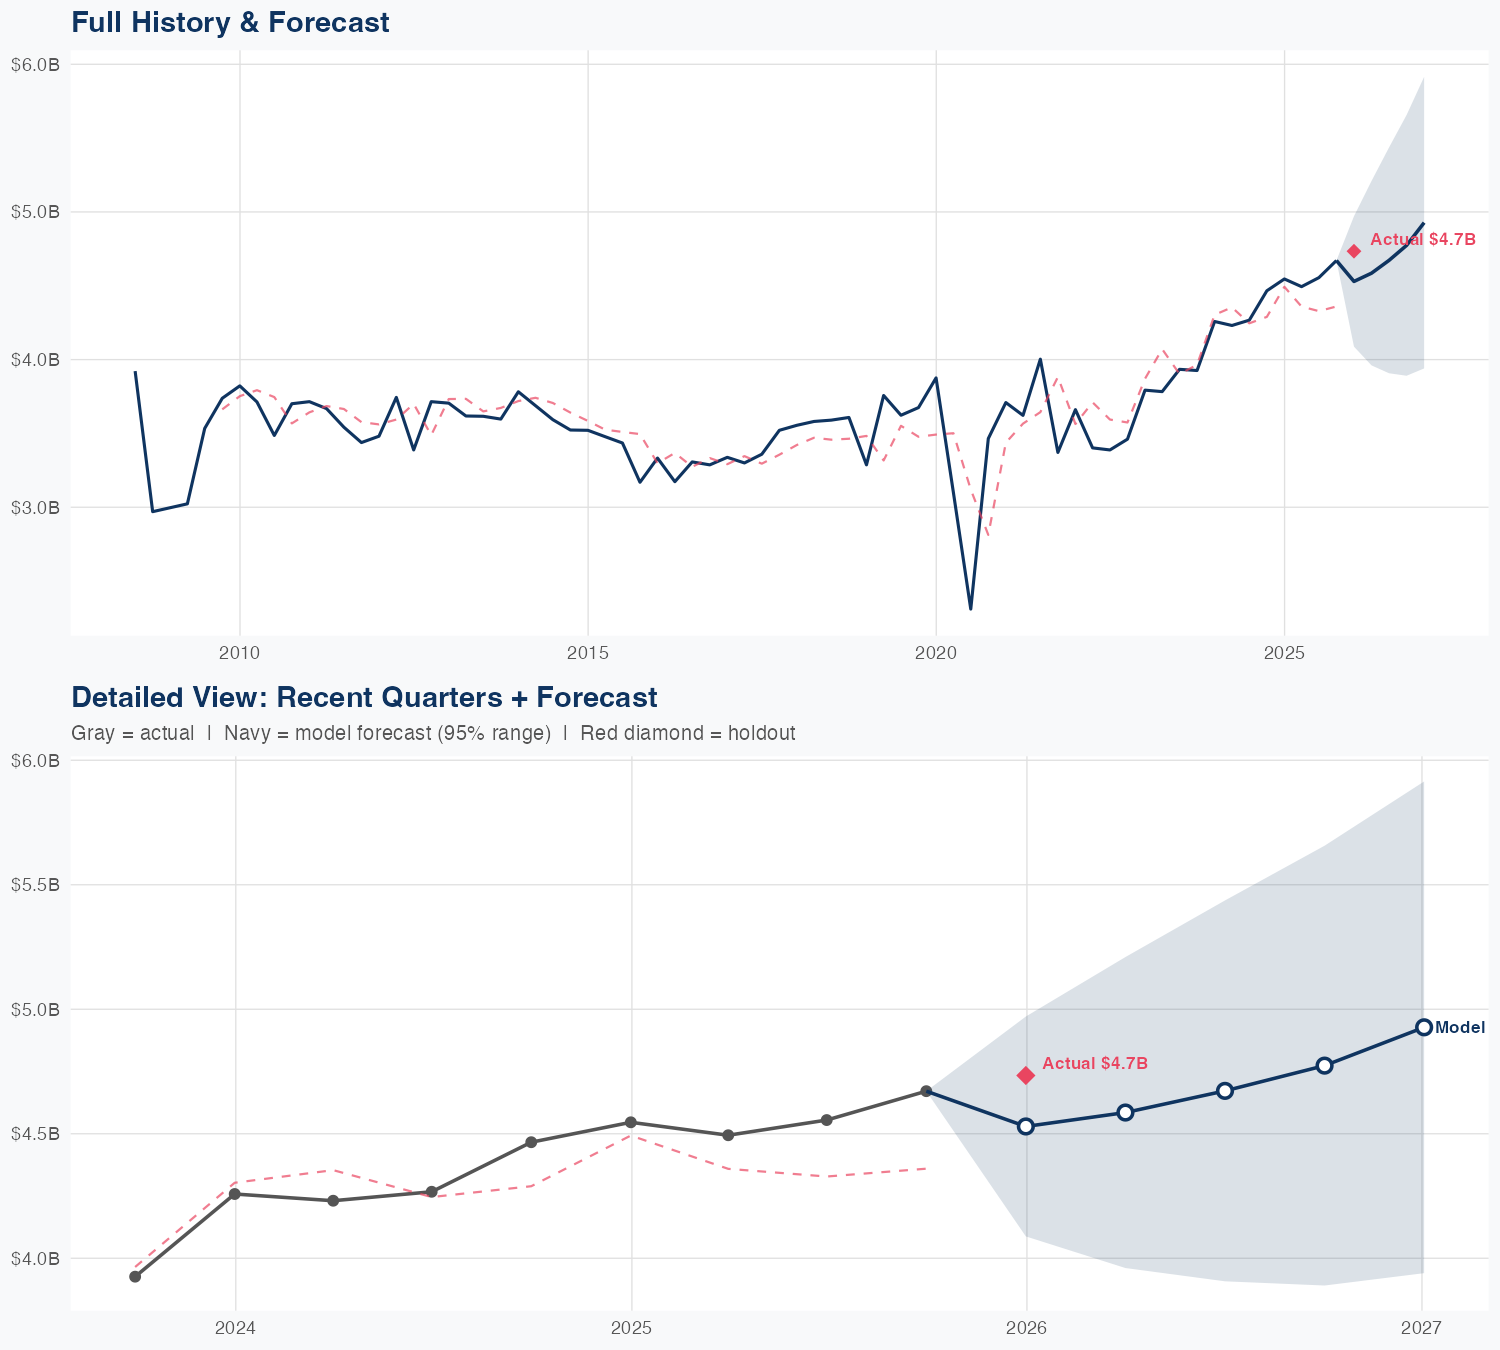
Quarterly Detail
| Quarter | Model Forecast | Actual | 95% Range | YoY Growth | Status |
|---|---|---|---|---|---|
| Q4 2025 | $4.5B | $4.7B | $4.1B – $5.0B | -0.4% | ✓ In range |
| Q2 2026 | $4.6B | $4.0B – $5.2B | +2.0% | ||
| Q3 2026 | $4.7B | $3.9B – $5.4B | +2.6% | ||
| Q4 2026 | $4.8B | $3.9B – $5.7B | +2.2% | ||
| Q1 2027 | $4.9B | $3.9B – $5.9B | +4.1% |
Seasonal Factors
| Fiscal Quarter | Seasonal Factor | vs Trend | Interpretation | Obs. |
|---|---|---|---|---|
| FQ1 (Sep–Nov) | 1.0205 | +2.0% | In line with trend | 17 |
| FQ2 (Dec–Feb) | 1.0141 | +1.4% | In line with trend | 17 |
| FQ3 (Mar–May) | 0.9862 | -1.4% | In line with trend | 16 |
| FQ4 (Jun–Aug) | 1.005 | +0.5% | In line with trend | 16 |
How Spending Drives Revenue
Want this analysis for your portfolio?
I build custom revenue intelligence reports for investors and companies using SEC filing data, econometric modeling, and AI-powered insights.
Get in Touch