Lockheed Martin Corporation LMT
Revenue Intelligence Report • 16 quarters of SEC filing data • Updated 2026-03-15
We expect Lockheed Martin’s FY revenue to grow about 1% year over year to roughly $46.3 billion, with the uplift anchored in platform-scale programs and pricing power within the defense mix. The binding constraint on revenue growth is delivery capacity to fulfill the sizable program backlog and to ramp multi-year production without bottlenecks in manufacturing, supply chains, or labor. In our econometric model, structural/platform growth accounts for about 73% of the projected rise, while SG&A efficiency adds incremental lift and R&D spend remains negligible. Key risk: execution delays on large, multi-year programs or supplier disruptions could cap upside and extend lead times.
Investment Thesis
Our ARDL model tracks Lockheed Martin Corporation's revenue with exceptional precision (2.4% MAPE), indicating highly predictable cash flows. Each $1 of SG&A spending generates $0.70 in revenue, reflecting strong commercial efficiency.
Revenue Forecast
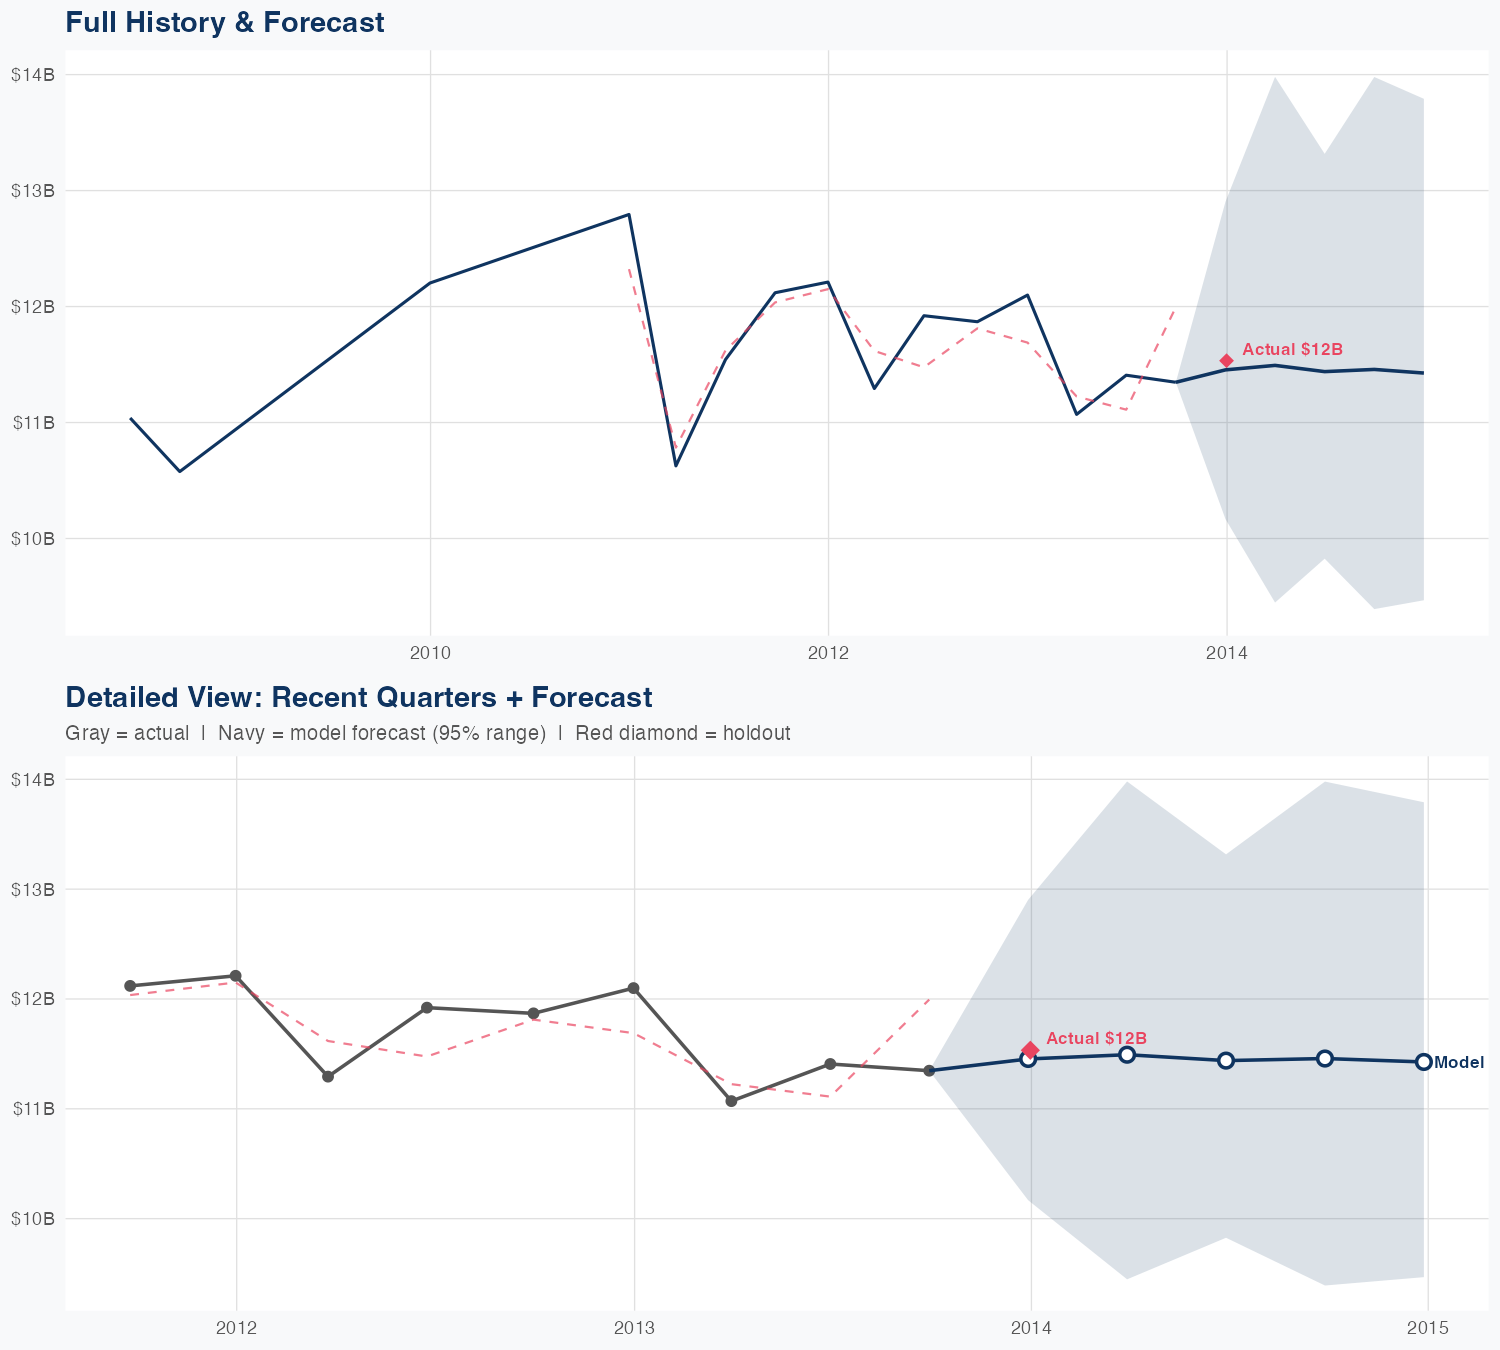
Quarterly Detail
| Quarter | Model Forecast | Actual | 95% Range | YoY Growth | Status |
|---|---|---|---|---|---|
| Q4 2013 | $11B | $12B | $10B – $13B | -5.3% | ✓ In range |
| Q1 2014 | $11B | $9.4B – $14B | +3.8% | ||
| Q2 2014 | $11B | $9.8B – $13B | +0.3% | ||
| Q3 2014 | $11B | $9.4B – $14B | +1.0% | ||
| Q4 2014 | $11B | $9.5B – $14B | -0.9% |
Seasonal Factors
| Fiscal Quarter | Seasonal Factor | vs Trend | Interpretation | Obs. |
|---|---|---|---|---|
| FQ1 (Sep–Nov) | 1.0048 | +0.5% | In line with trend | 3 |
| FQ2 (Dec–Feb) | 1.0351 | +3.5% | +3.5% above trend | 4 |
| FQ3 (Mar–May) | 0.9854 | -1.5% | In line with trend | 3 |
| FQ4 (Jun–Aug) | 1.0267 | +2.7% | In line with trend | 3 |
How Spending Drives Revenue
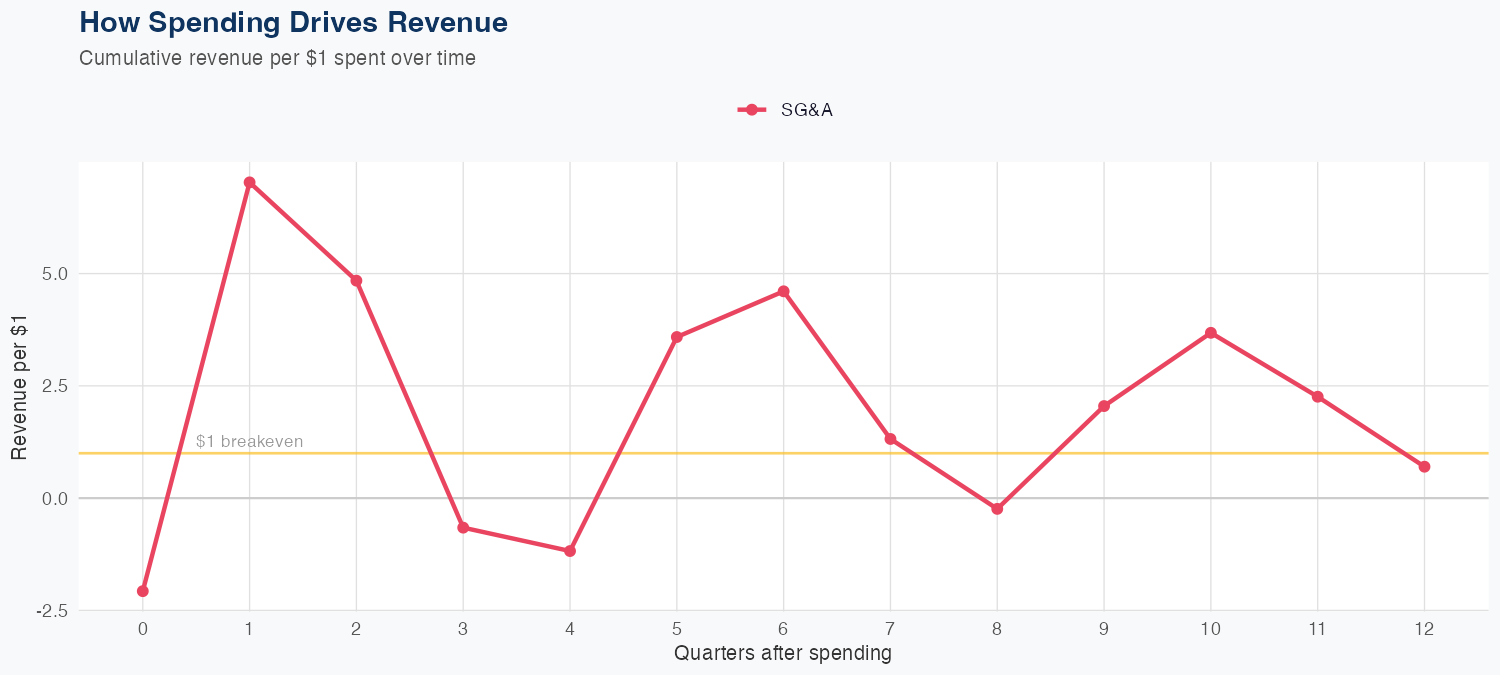
Spending Efficiency Over Time
Current SG&A multiplier: -0.0119
Want this analysis for your portfolio?
I build custom revenue intelligence reports for investors and companies using SEC filing data, econometric modeling, and AI-powered insights.
Get in Touch