Southwest Airlines Co LUV
Revenue Intelligence Report • 62 quarters of SEC filing data • Updated 2026-03-15
The revenue outlook for Southwest is a negative 4.6% year over year, with FY26 revenue around 26.8 billion and near-term demand softening, even as structural network growth and cost leverage provide a longer-run upside. Binding constraint: capacity constraints—aircraft and crew availability that limit flight volumes and revenue upside, despite rising SG&A efficiency. Our econometric model shows SG&A spending is the primary growth lever, with structural growth contributing about a quarter; the model notes the SG&A multiplier has risen, implying incremental spend yields outsized topline gains if capacity supports it. Key risk: sustained demand deterioration or ongoing capacity bottlenecks that prevent the SG&A-driven revenue upside from fully materializing.
Investment Thesis
At 10.5% MAPE, the model captures Southwest Airlines Co's broad revenue trajectory, though quarterly variability suggests sensitivity to external factors. Each $1 of SG&A spending generates $1.19 in revenue, reflecting strong commercial efficiency.
Revenue Forecast
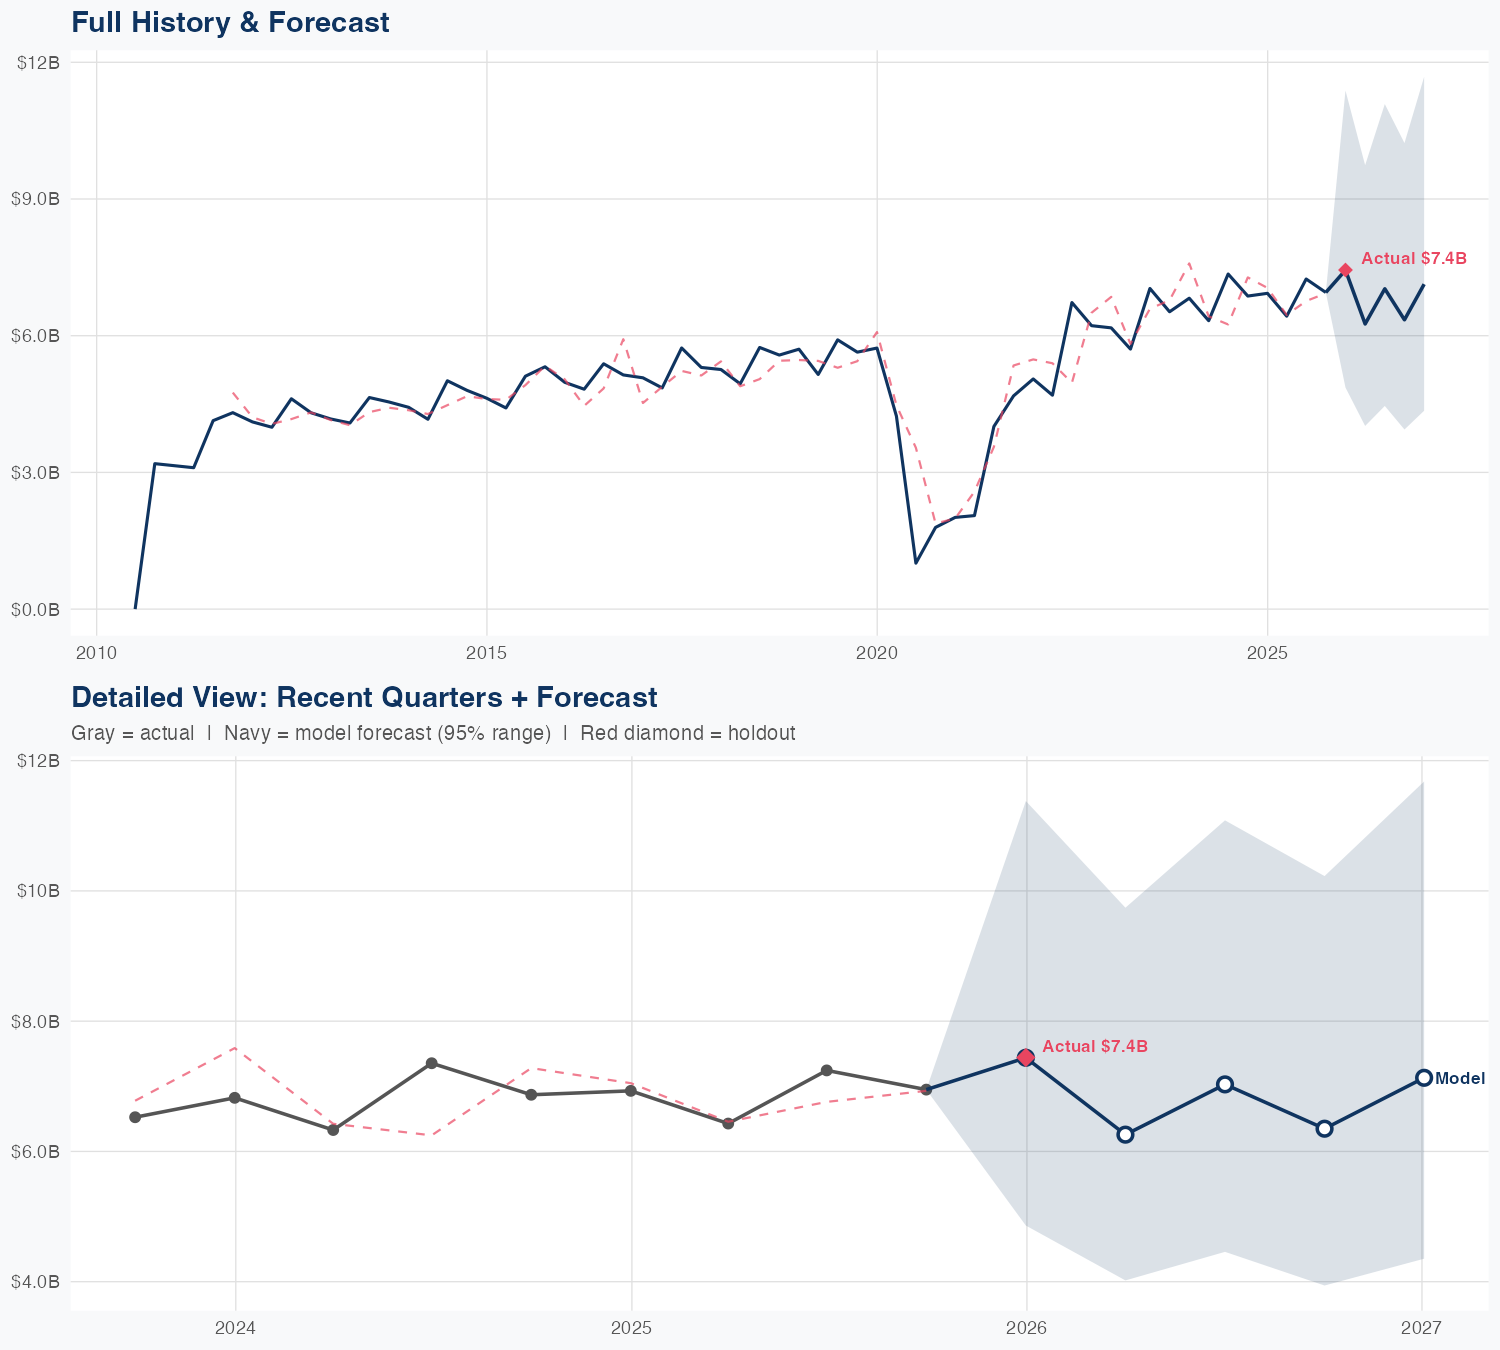
Quarterly Detail
| Quarter | Model Forecast | Actual | 95% Range | YoY Growth | Status |
|---|---|---|---|---|---|
| Q4 2025 | $7.4B | $7.4B | $4.9B – $11B | +7.3% | ✓ In range |
| Q2 2026 | $6.3B | $4.0B – $9.7B | -2.6% | ||
| Q3 2026 | $7.0B | $4.5B – $11B | -3.0% | ||
| Q4 2026 | $6.3B | $3.9B – $10B | -8.6% | ||
| Q1 2027 | $7.1B | $4.4B – $12B | -4.2% |
Seasonal Factors
| Fiscal Quarter | Seasonal Factor | vs Trend | Interpretation | Obs. |
|---|---|---|---|---|
| FQ1 (Sep–Nov) | 0.9964 | -0.4% | In line with trend | 15 |
| FQ2 (Dec–Feb) | 0.9871 | -1.3% | In line with trend | 15 |
| FQ3 (Mar–May) | 0.9819 | -1.8% | In line with trend | 14 |
| FQ4 (Jun–Aug) | 1.1118 | +11.2% | +11.2% above trend | 14 |
How Spending Drives Revenue
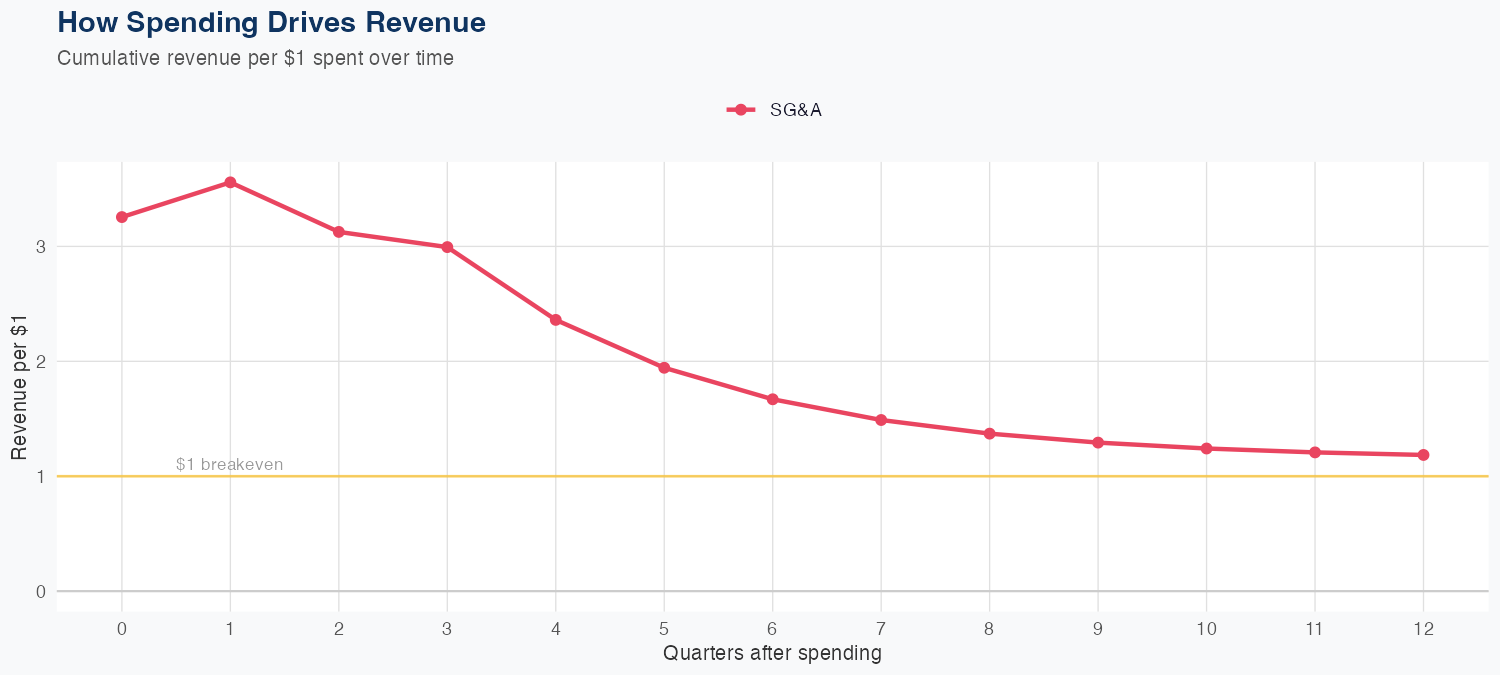
Spending Efficiency Over Time
Current SG&A multiplier: 3.3786
Want this analysis for your portfolio?
I build custom revenue intelligence reports for investors and companies using SEC filing data, econometric modeling, and AI-powered insights.
Get in Touch