Monster Beverage Corp MNST
Revenue Intelligence Report • 36 quarters of SEC filing data • Updated 2026-03-15
Revenue is forecast to grow about 4% year over year, with the lift coming from structural/platform growth and pricing power rather than incremental SG&A spending. The binding constraint on revenue growth is distribution capacity and retailer shelf space to scale nationwide; despite positive demand, our econometric model shows SG&A elasticity trending toward zero and structural growth acting as the engine. Forecast attribution currently assigns roughly 85% of growth to structural/platform effects, about 15% to SG&A, and essentially no contribution from R&D, underscoring leverage from a scalable model rather than spend. Key risk: if distribution capacity or shelf allocations fail to keep pace with demand, the upside could be constrained.
Investment Thesis
The econometric model achieves strong accuracy (3.2% MAPE), suggesting Monster Beverage Corp's revenue trajectory is well-characterized by its spending patterns.
Revenue Forecast
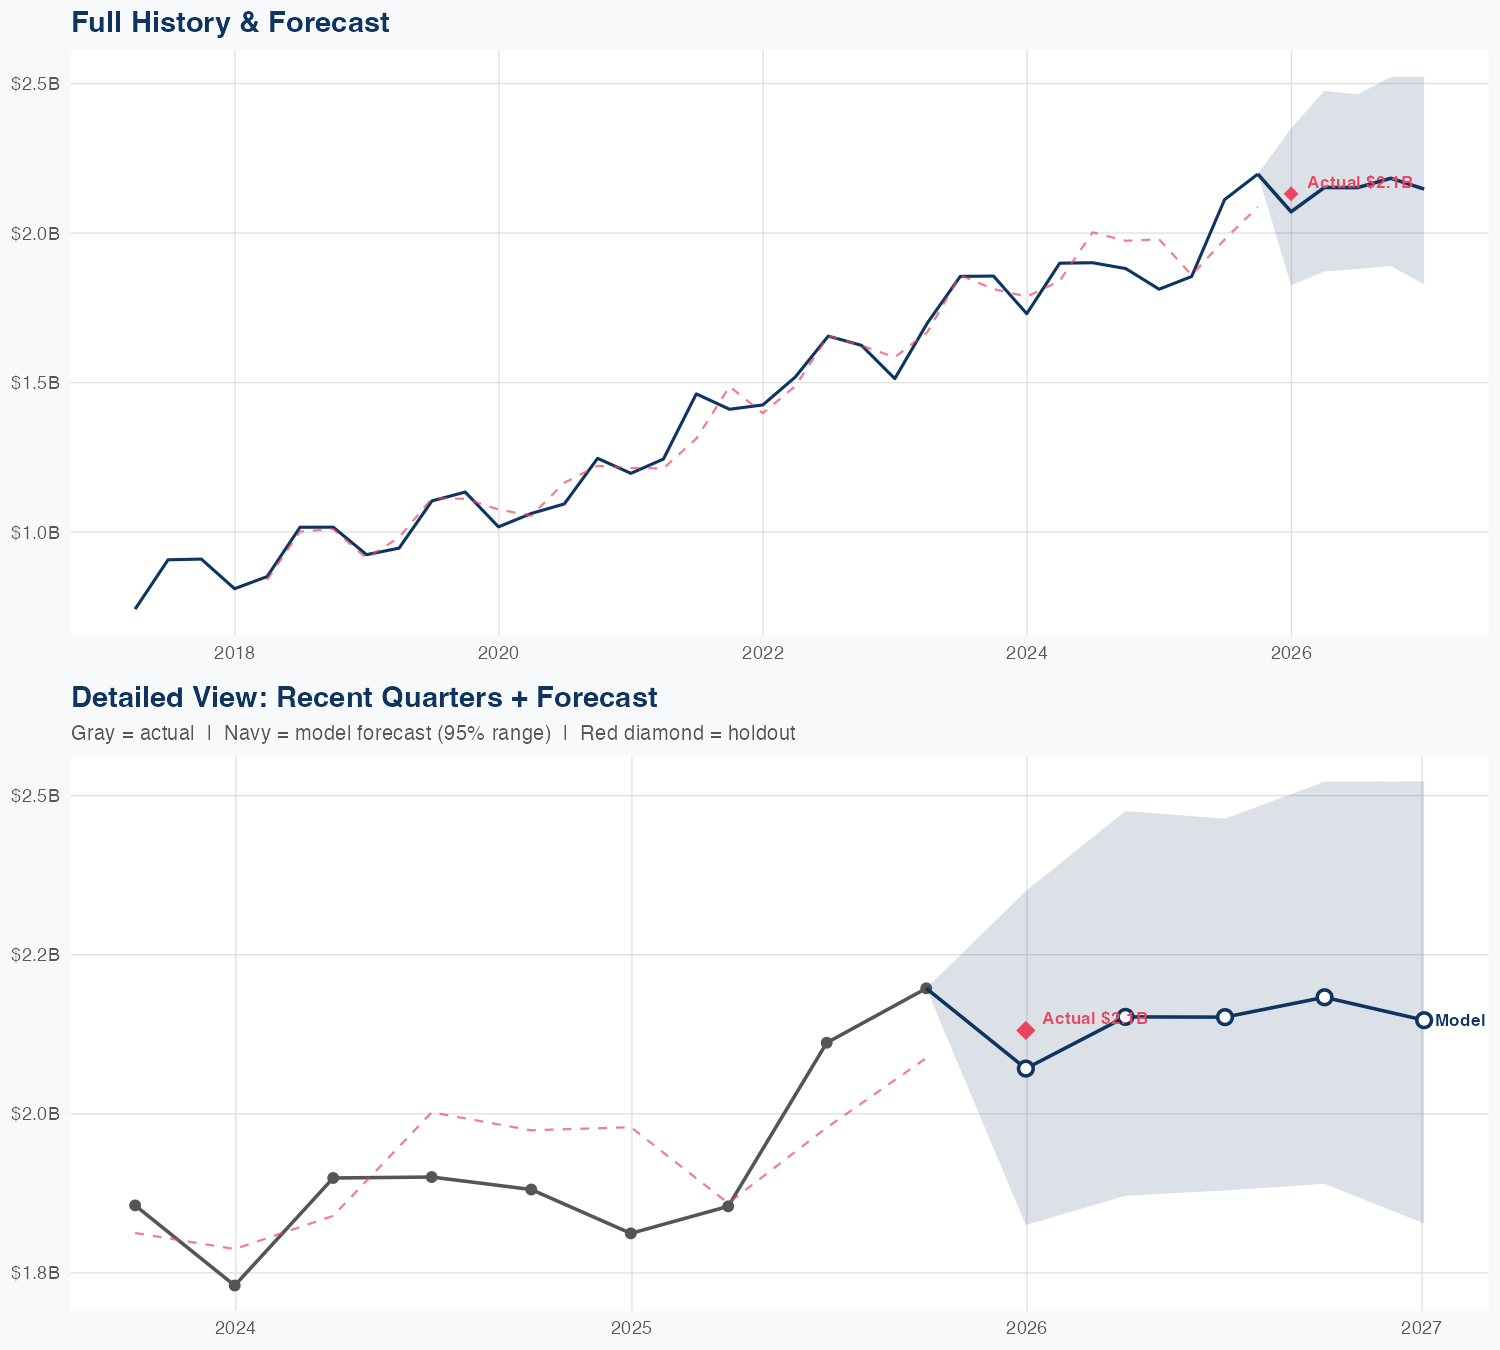
Quarterly Detail
| Quarter | Model Forecast | Actual | 95% Range | YoY Growth | Status |
|---|---|---|---|---|---|
| Q4 2025 | $2.1B | $2.1B | $1.8B – $2.4B | +14.3% | ✓ In range |
| Q2 2026 | $2.2B | $1.9B – $2.5B | +16.1% | ||
| Q3 2026 | $2.2B | $1.9B – $2.5B | +1.9% | ||
| Q4 2026 | $2.2B | $1.9B – $2.5B | -0.6% | ||
| Q1 2027 | $2.1B | $1.8B – $2.5B | +0.8% |
Seasonal Factors
| Fiscal Quarter | Seasonal Factor | vs Trend | Interpretation | Obs. |
|---|---|---|---|---|
| FQ1 (Sep–Nov) | 1.0203 | +2.0% | In line with trend | 8 |
| FQ2 (Dec–Feb) | 0.9852 | -1.5% | In line with trend | 8 |
| FQ3 (Mar–May) | 1.0183 | +1.8% | In line with trend | 8 |
| FQ4 (Jun–Aug) | 0.9995 | -0.0% | In line with trend | 8 |
How Spending Drives Revenue
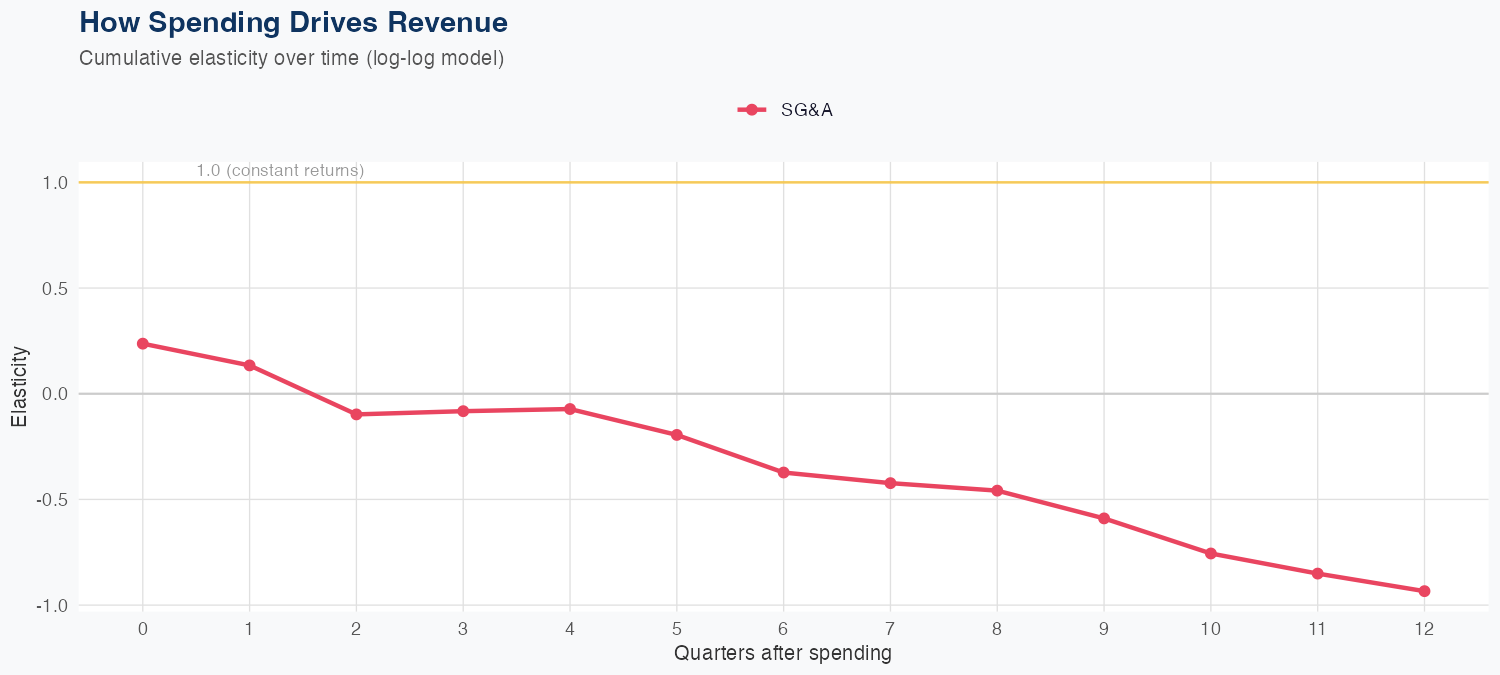
Spending Efficiency Over Time
Current SG&A elasticity: -0.094x
Want this analysis for your portfolio?
I build custom revenue intelligence reports for investors and companies using SEC filing data, econometric modeling, and AI-powered insights.
Get in Touch