Marsh & Mclennan Companies, Inc. MRSH
Revenue Intelligence Report • 36 quarters of SEC filing data • Updated 2026-03-15
Revenue is forecast to grow about 15% year over year to roughly $36 billion, supported by a structural/platform uplift of around 6% and a strong contribution from SG&A investment. The binding constraint on growth is incremental SG&A capacity—the ability to deploy additional sales, marketing and client-service resources to fund more growth. Our econometric model shows SG&A spending is the primary growth engine, accounting for roughly 94% of the topline lift, with the SG&A multiplier rising to about 1.76x, implying incremental spend now yields outsized topline gains. Key risk: if incremental SG&A investments lose efficiency or macro demand cools, the anticipated 15% growth could decelerate, making the forecast highly sensitive to selling-resource expansion.
Investment Thesis
Our ARDL model tracks Marsh & Mclennan Companies, Inc.'s revenue with exceptional precision (1.4% MAPE), indicating highly predictable cash flows. Each $1 of SG&A spending generates $1.50 in revenue, reflecting strong commercial efficiency.
Revenue Forecast
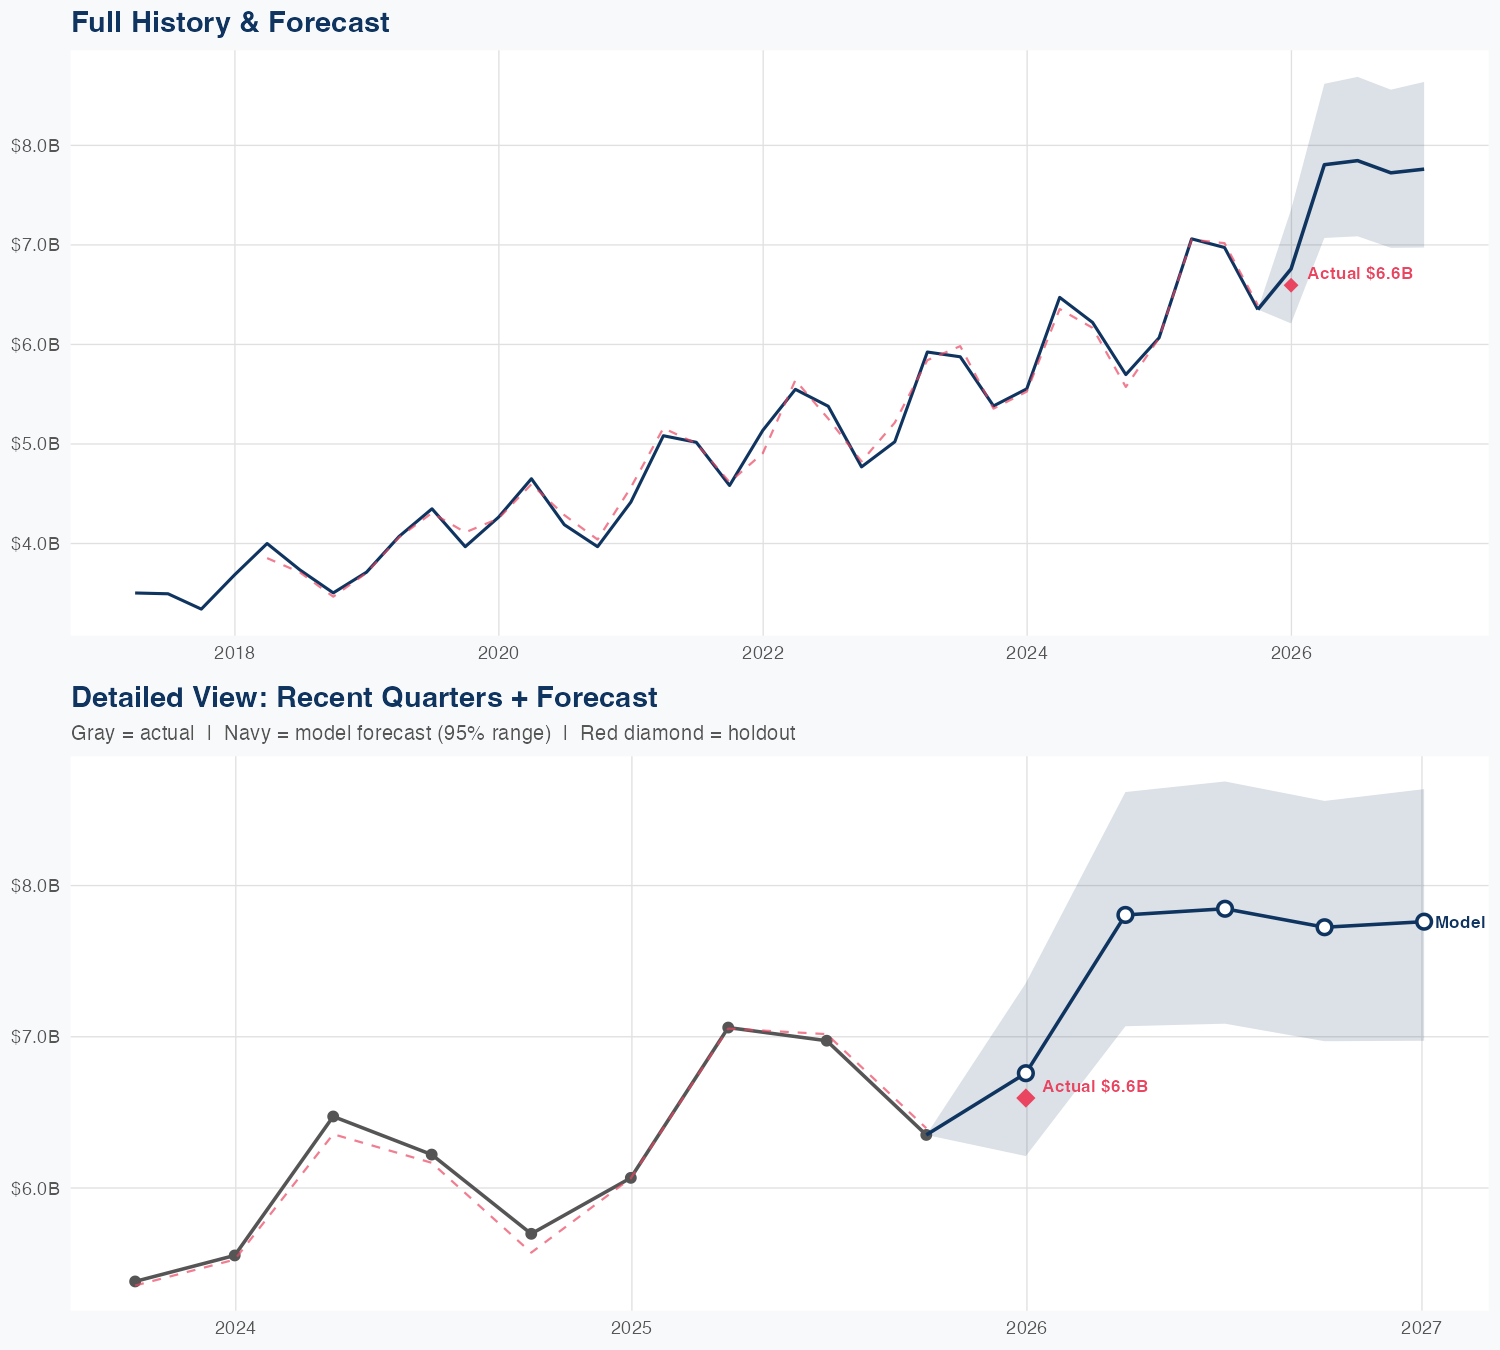
Quarterly Detail
| Quarter | Model Forecast | Actual | 95% Range | YoY Growth | Status |
|---|---|---|---|---|---|
| Q4 2025 | $6.8B | $6.6B | $6.2B – $7.4B | +11.4% | ✓ In range |
| Q2 2026 | $7.8B | $7.1B – $8.6B | +10.5% | ||
| Q3 2026 | $7.8B | $7.1B – $8.7B | +12.5% | ||
| Q4 2026 | $7.7B | $7.0B – $8.6B | +21.6% | ||
| Q1 2027 | $7.8B | $7.0B – $8.6B | +17.7% |
Seasonal Factors
| Fiscal Quarter | Seasonal Factor | vs Trend | Interpretation | Obs. |
|---|---|---|---|---|
| FQ1 (Sep–Nov) | 0.9931 | -0.7% | In line with trend | 8 |
| FQ2 (Dec–Feb) | 1.002 | +0.2% | In line with trend | 8 |
| FQ3 (Mar–May) | 1.0119 | +1.2% | In line with trend | 8 |
| FQ4 (Jun–Aug) | 1.0065 | +0.7% | In line with trend | 8 |
How Spending Drives Revenue
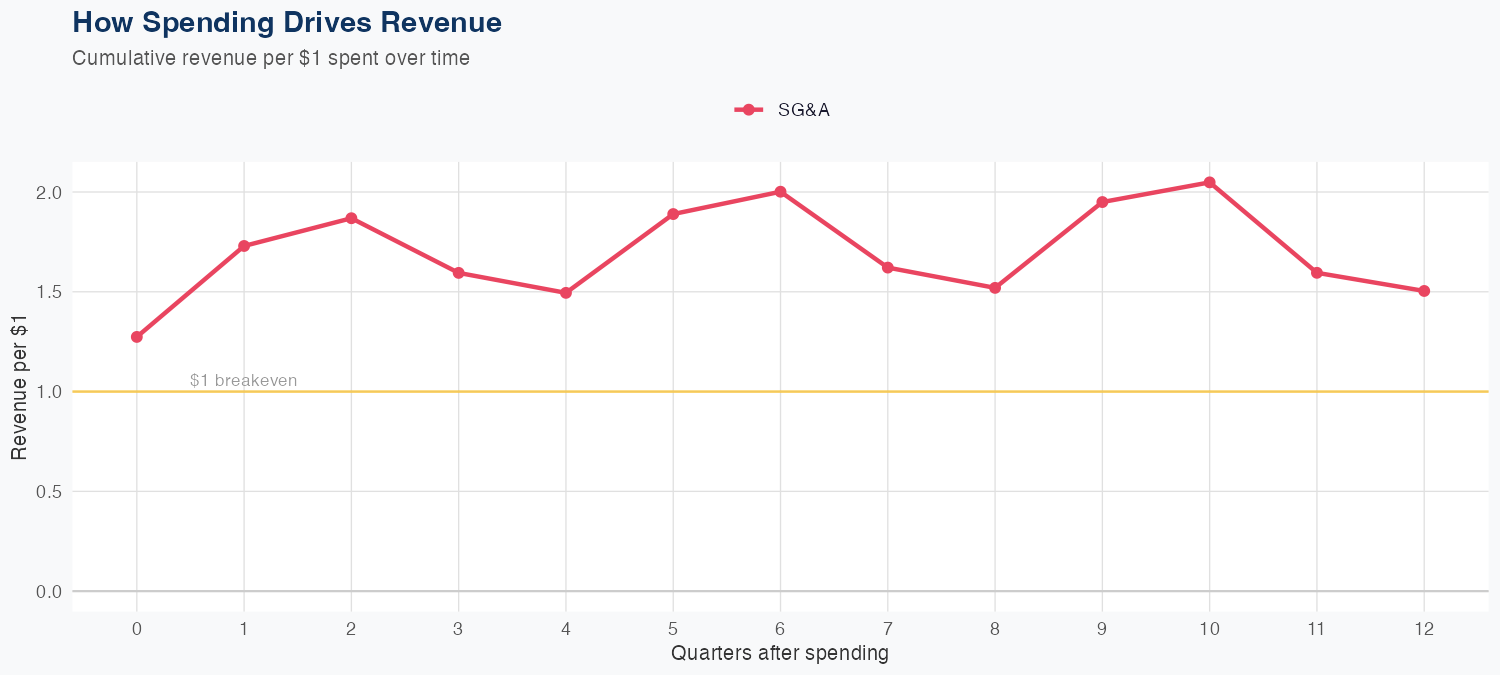
Spending Efficiency Over Time
Current SG&A multiplier: 1.7571
Want this analysis for your portfolio?
I build custom revenue intelligence reports for investors and companies using SEC filing data, econometric modeling, and AI-powered insights.
Get in Touch