Nasdaq, Inc. NDAQ
Revenue Intelligence Report • 66 quarters of SEC filing data • Updated 2026-03-15
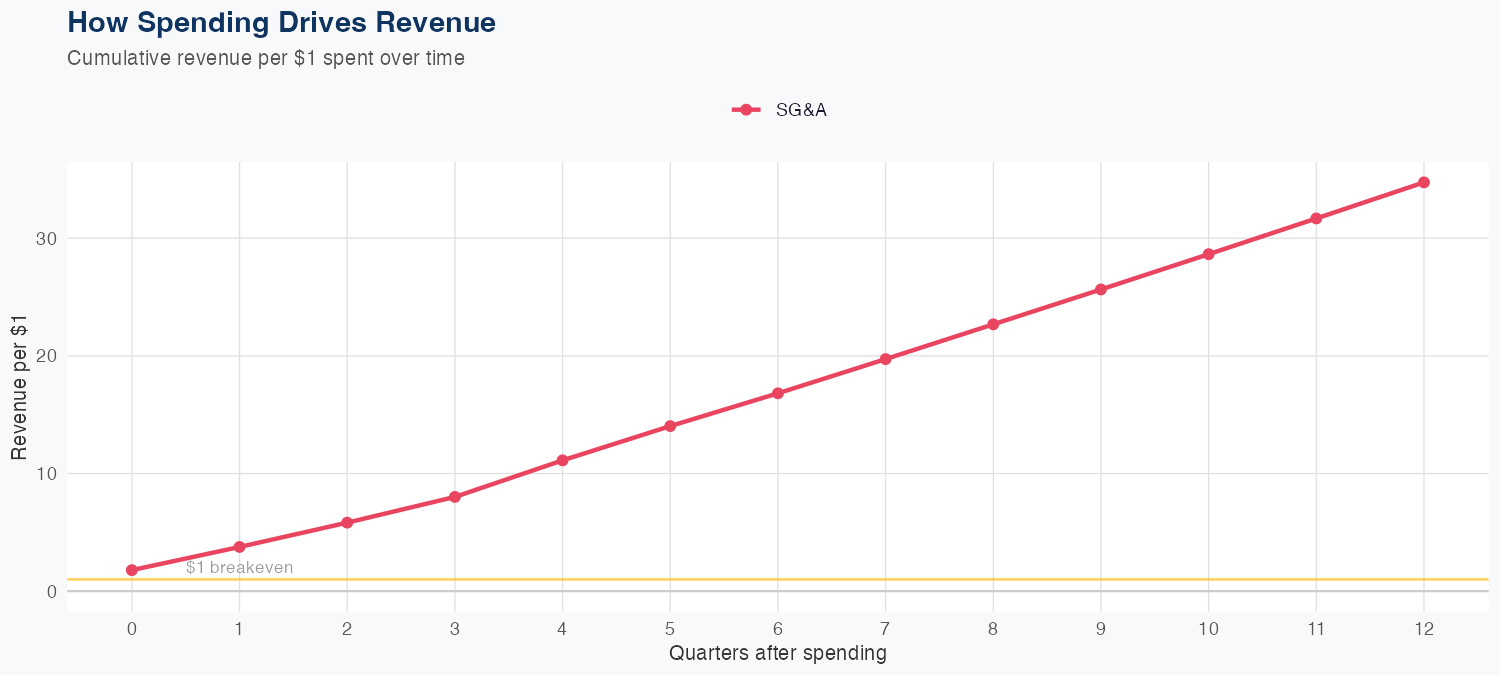
Revenue is driven by strong operating leverage from SG&A activities, with $1 of SG&A spending expected to generate about $34.75 in long-run revenue. The latest quarterly revenue came in at $2.124 billion. A linear model trained on 66 quarters of data yields a full-year forecast of $7.9 billion, representing a 4.3% decline year over year, with holdout accuracy of 5.6% (predicted $2.0B vs actual $2.1B) and an overall MAPE of 5.8%. This suggests meaningful cost-to-revenue leverage but a modest near-term headwind to topline, underscoring the importance of cost discipline and revenue mix in supporting the outlook.
Investment Thesis
The econometric model achieves strong accuracy (5.8% MAPE), suggesting Nasdaq, Inc.'s revenue trajectory is well-characterized by its spending patterns. Each $1 of SG&A spending generates $34.75 in revenue, reflecting strong commercial efficiency.
Revenue Forecast
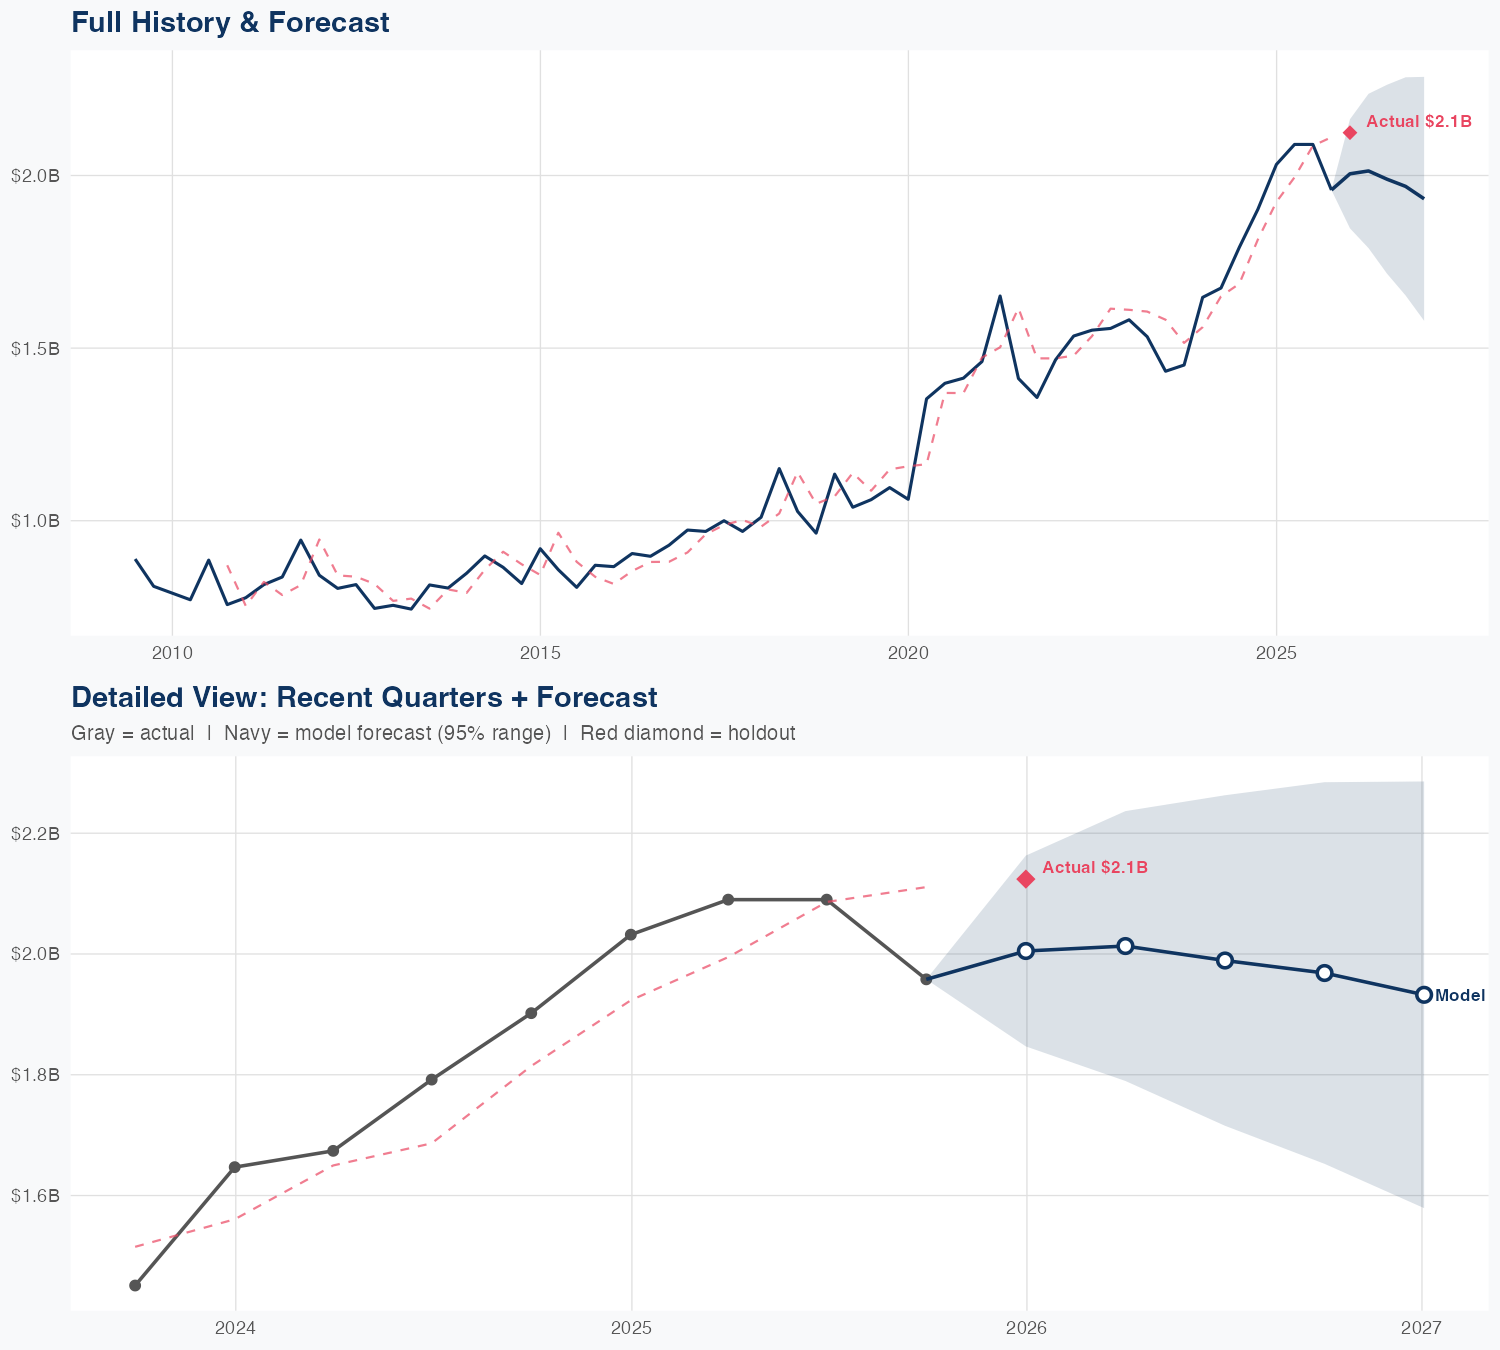
Quarterly Detail
| Quarter | Model Forecast | Actual | 95% Range | YoY Growth | Status |
|---|---|---|---|---|---|
| Q4 2025 | $2.0B | $2.1B | $1.8B – $2.2B | -1.3% | ✓ In range |
| Q2 2026 | $2.0B | $1.8B – $2.2B | -3.7% | ||
| Q3 2026 | $2.0B | $1.7B – $2.3B | -4.8% | ||
| Q4 2026 | $2.0B | $1.7B – $2.3B | +0.5% | ||
| Q1 2027 | $1.9B | $1.6B – $2.3B | -9.0% |
Seasonal Factors
| Fiscal Quarter | Seasonal Factor | vs Trend | Interpretation | Obs. |
|---|---|---|---|---|
| FQ1 (Sep–Nov) | 0.9645 | -3.5% | -3.5% below trend | 16 |
| FQ2 (Dec–Feb) | 1.0466 | +4.7% | +4.7% above trend | 16 |
| FQ3 (Mar–May) | 1.0147 | +1.5% | In line with trend | 15 |
| FQ4 (Jun–Aug) | 1.0019 | +0.2% | In line with trend | 15 |
How Spending Drives Revenue
Want this analysis for your portfolio?
I build custom revenue intelligence reports for investors and companies using SEC filing data, econometric modeling, and AI-powered insights.
Get in Touch