Norfolk Southern Corporation NSC
Revenue Intelligence Report • 69 quarters of SEC filing data • Updated 2026-03-15
Revenue is forecast to decline about 4% year over year, as freight volumes soften, while structural platform effects provide a partial offset and a path toward stabilization later in the cycle. The binding constraint on revenue growth appears to be delivery capacity within the rail network—yard congestion, crew and locomotive availability, and intermodal bottlenecks that prevent monetizing demand. Our econometric model attributes roughly 80% of current revenue growth to structural/platform factors and 20% to SG&A, with no contribution from R&D, implying spending is maintenance rather than the growth lever. Time-varying analysis shows SG&A elasticity has trended lower (historically above 1x and now near zero), reinforcing the view that operating leverage is lifting revenue without proportional expense growth. Key risk to the thesis is a sharper-than-expected deterioration in freight demand or a persistent capacity constraint that caps the realization of structural growth.
Investment Thesis
The econometric model achieves strong accuracy (3.3% MAPE), suggesting Norfolk Southern Corporation's revenue trajectory is well-characterized by its spending patterns.
Revenue Forecast
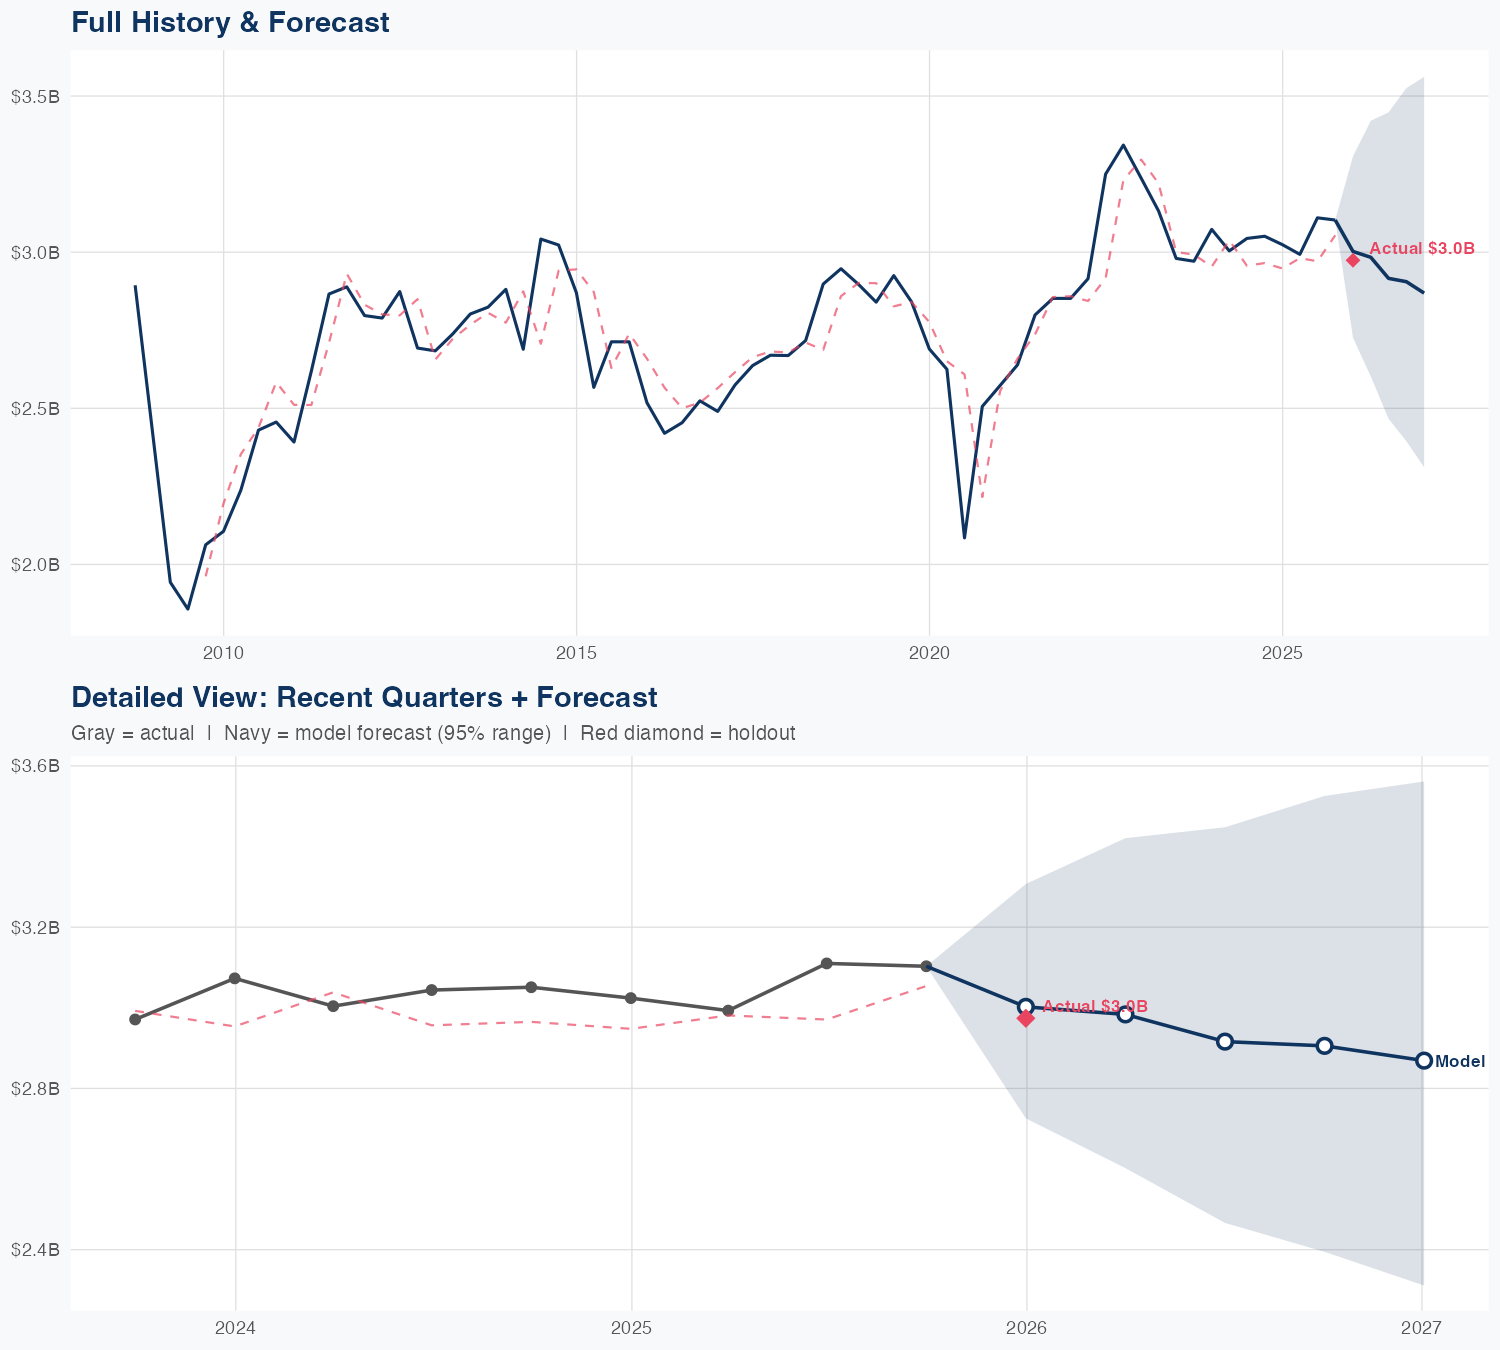
Quarterly Detail
| Quarter | Model Forecast | Actual | 95% Range | YoY Growth | Status |
|---|---|---|---|---|---|
| Q4 2025 | $3.0B | $3.0B | $2.7B – $3.3B | -0.7% | ✓ In range |
| Q2 2026 | $3.0B | $2.6B – $3.4B | -0.3% | ||
| Q3 2026 | $2.9B | $2.5B – $3.4B | -6.2% | ||
| Q4 2026 | $2.9B | $2.4B – $3.5B | -6.4% | ||
| Q1 2027 | $2.9B | $2.3B – $3.6B | -3.5% |
Seasonal Factors
| Fiscal Quarter | Seasonal Factor | vs Trend | Interpretation | Obs. |
|---|---|---|---|---|
| FQ1 (Sep–Nov) | 1.0025 | +0.2% | In line with trend | 17 |
| FQ2 (Dec–Feb) | 0.9877 | -1.2% | In line with trend | 17 |
| FQ3 (Mar–May) | 0.9903 | -1.0% | In line with trend | 16 |
| FQ4 (Jun–Aug) | 1.0296 | +3.0% | In line with trend | 16 |
How Spending Drives Revenue
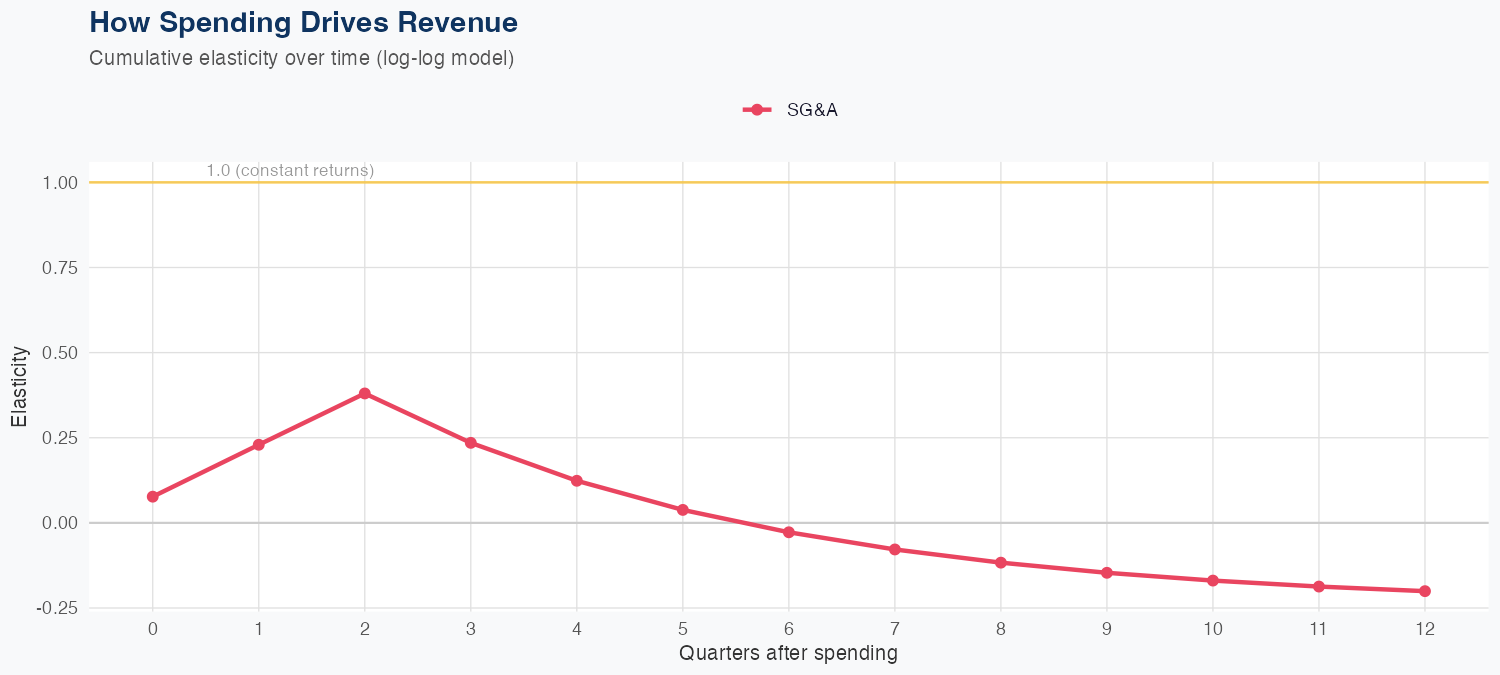
Spending Efficiency Over Time
Current SG&A elasticity: 0.152x
Want this analysis for your portfolio?
I build custom revenue intelligence reports for investors and companies using SEC filing data, econometric modeling, and AI-powered insights.
Get in Touch