Northern Trust Corporation NTRS
Revenue Intelligence Report • 70 quarters of SEC filing data • Updated 2026-03-15
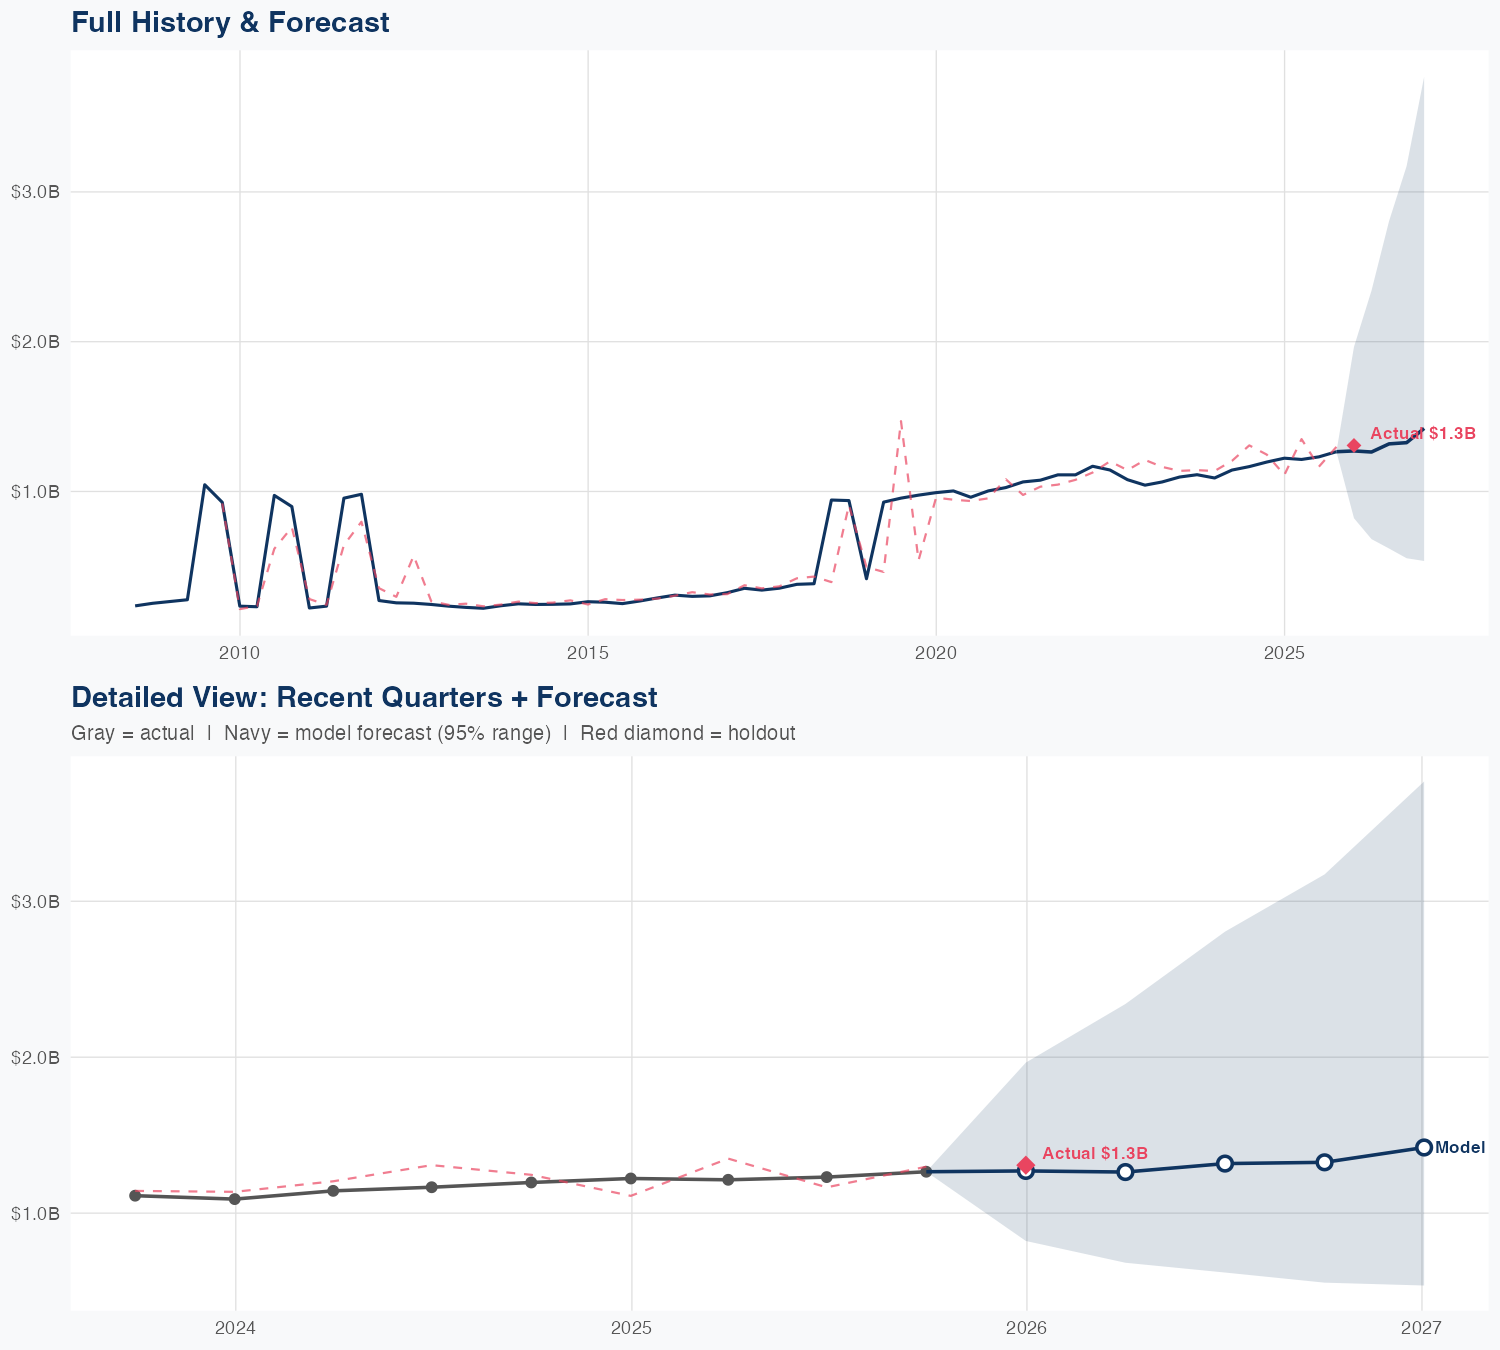
Revenue is on a clear uptrend, with FY revenue forecast to rise about 6% year over year to roughly $5.6 billion. This outlook reflects sturdy fee-based earnings from wealth and asset servicing, supported by stable client activity and assets under management, and our econometric model shows SG&A spend is highly revenue-levered (about 2.4% revenue per 1% SG&A) with elasticity rising over the sample period—from about -1.18x to -0.40x—so incremental spending now yields more topline growth. Our forecast has been validated in out-of-sample testing: the holdout predicted around $1.3 billion with a 2.8% error, and overall MAPE sits near 12.6%. Key risk is sensitivity to market cycles and asset flows; a meaningful downturn or competitive pressure could dampen revenue.
Investment Thesis
At 12.6% MAPE, the model captures Northern Trust Corporation's broad revenue trajectory, though quarterly variability suggests sensitivity to external factors. Sales & marketing spend shows a 2.41x elasticity, suggesting effective go-to-market execution.
Revenue Forecast
Quarterly Detail
| Quarter | Model Forecast | Actual | 95% Range | YoY Growth | Status |
|---|---|---|---|---|---|
| Q4 2025 | $1.3B | $1.3B | $0.8B – $2.0B | +4.0% | ✓ In range |
| Q2 2026 | $1.3B | $0.7B – $2.3B | +4.1% | ||
| Q3 2026 | $1.3B | $0.6B – $2.8B | +7.0% | ||
| Q4 2026 | $1.3B | $0.6B – $3.2B | +4.8% | ||
| Q1 2027 | $1.4B | $0.5B – $3.8B | +8.7% |
Seasonal Factors
| Fiscal Quarter | Seasonal Factor | vs Trend | Interpretation | Obs. |
|---|---|---|---|---|
| FQ1 (Sep–Nov) | 0.9732 | -2.7% | In line with trend | 17 |
| FQ2 (Dec–Feb) | 0.959 | -4.1% | -4.1% below trend | 17 |
| FQ3 (Mar–May) | 0.9651 | -3.5% | -3.5% below trend | 16 |
| FQ4 (Jun–Aug) | 0.9638 | -3.6% | -3.6% below trend | 16 |
How Spending Drives Revenue
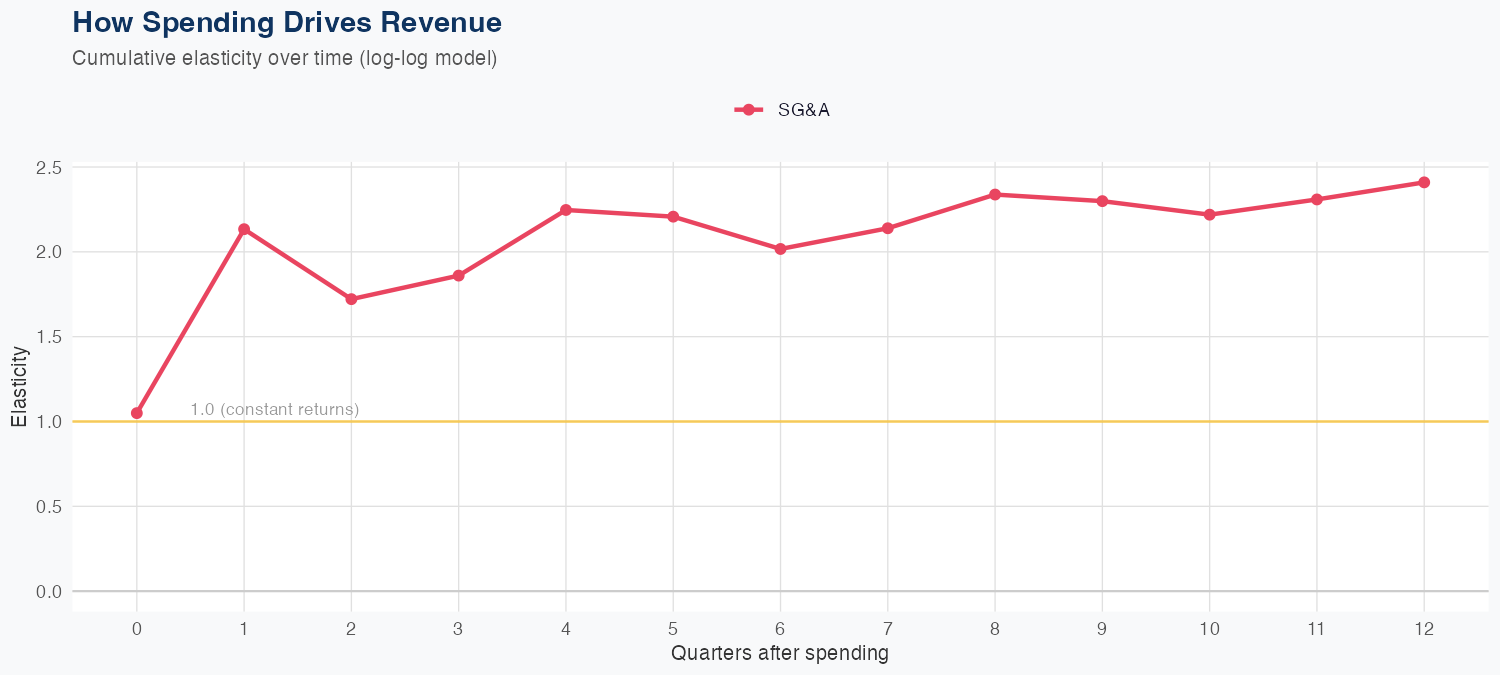
Spending Efficiency Over Time
Current SG&A elasticity: -0.4016x
Want this analysis for your portfolio?
I build custom revenue intelligence reports for investors and companies using SEC filing data, econometric modeling, and AI-powered insights.
Get in Touch