Public Service Enterprise Group Incorporated PEG
Revenue Intelligence Report • 46 quarters of SEC filing data • Updated 2026-03-15
PEG’s revenue is forecast to grow about 6% year over year to roughly $11.3 billion, supported by a blend of structural/platform expansion and ongoing operating leverage within its regulated utility franchise. The binding constraint on revenue growth appears to be the regulatory approvals and rate-framework timing for capital investments and cost recovery of grid and generation assets. Our econometric model shows SG&A elasticity has trended lower over time—from about 0.92x toward 0.66x—suggesting rising operating leverage and that growth is increasingly driven by platform scale and recurring revenue rather than incremental spending; R&D contributions are negligible. Key risk: regulatory approval delays or unfavorable rate-case outcomes that limit allowed revenue growth and capex recovery.
Investment Thesis
The econometric model achieves strong accuracy (4.6% MAPE), suggesting Public Service Enterprise Group Incorporated's revenue trajectory is well-characterized by its spending patterns. Sales & marketing spend shows a 1.24x elasticity, suggesting effective go-to-market execution.
Revenue Forecast
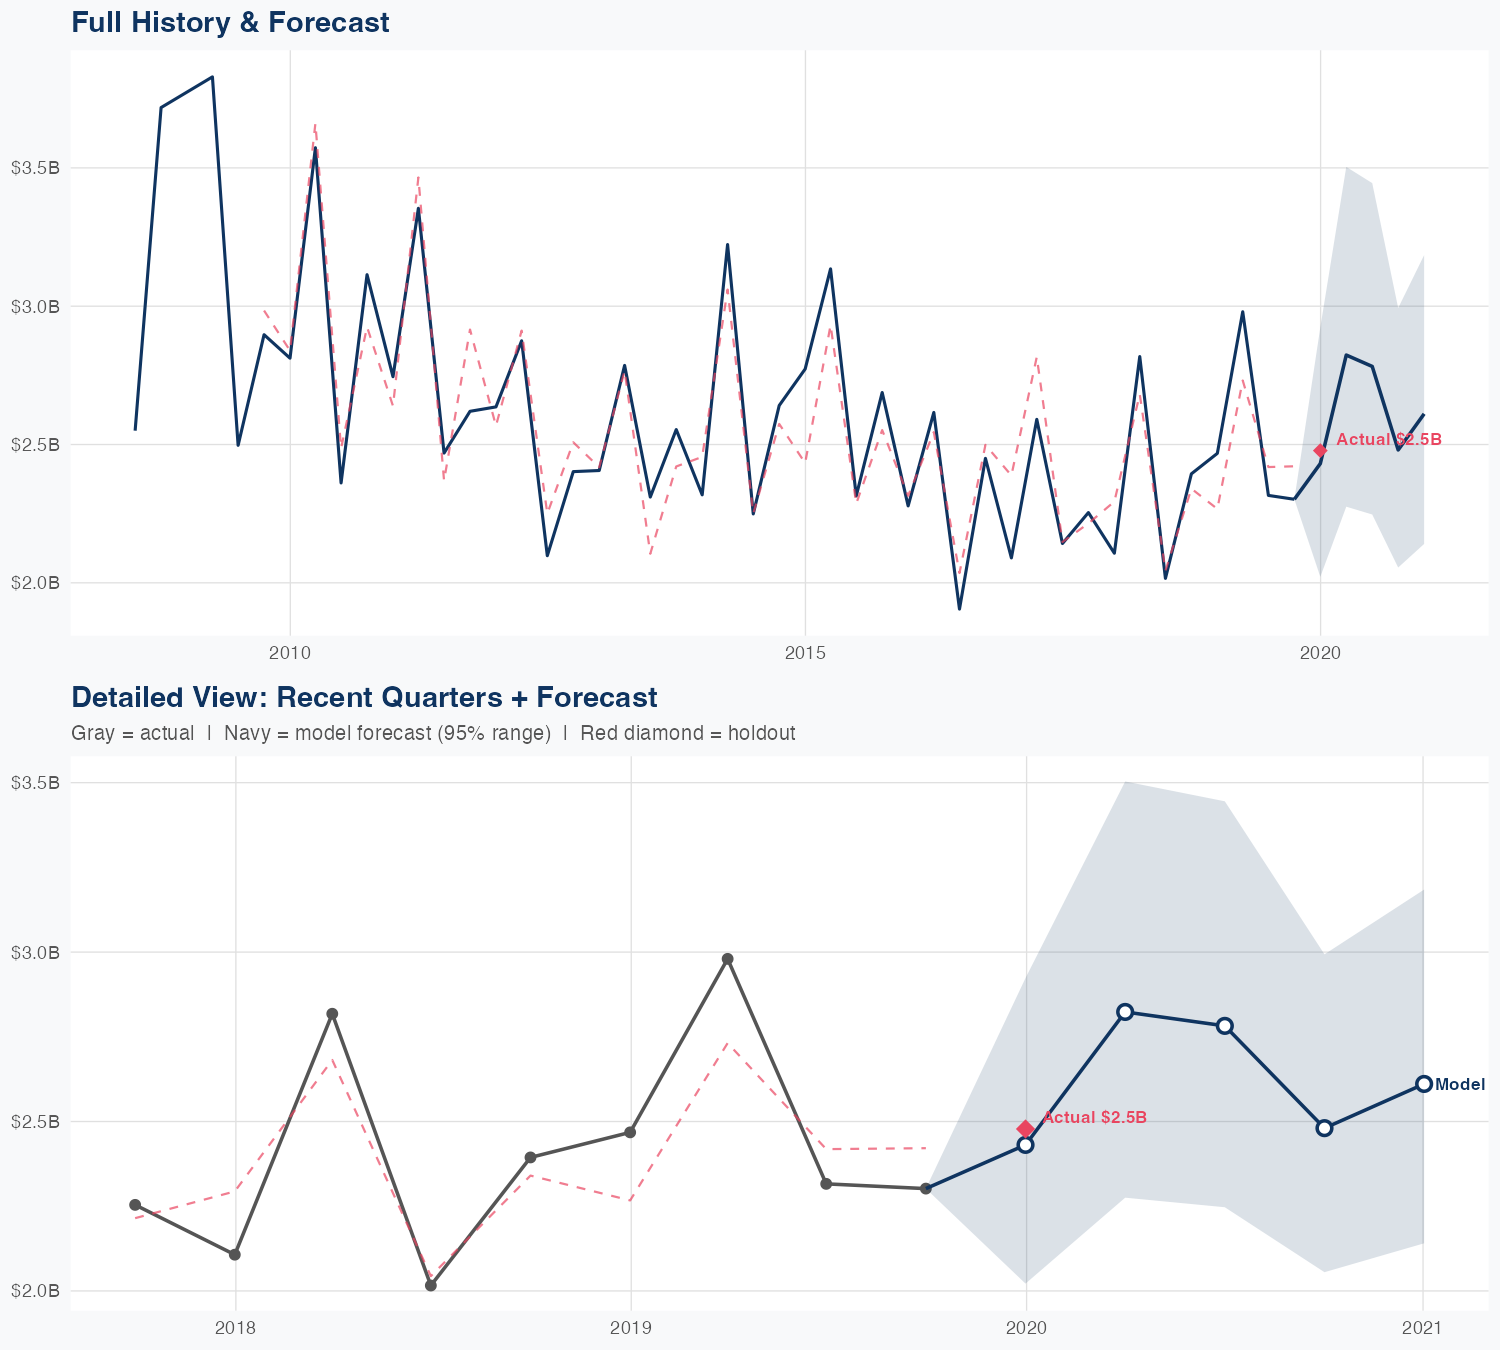
Quarterly Detail
| Quarter | Model Forecast | Actual | 95% Range | YoY Growth | Status |
|---|---|---|---|---|---|
| Q4 2019 | $2.4B | $2.5B | $2.0B – $2.9B | -1.5% | ✓ In range |
| Q2 2020 | $2.8B | $2.3B – $3.5B | -5.3% | ||
| Q3 2020 | $2.8B | $2.2B – $3.4B | +20.1% | ||
| Q4 2020 | $2.5B | $2.1B – $3.0B | +7.7% | ||
| Q1 2021 | $2.6B | $2.1B – $3.2B | +5.4% |
Seasonal Factors
| Fiscal Quarter | Seasonal Factor | vs Trend | Interpretation | Obs. |
|---|---|---|---|---|
| FQ1 (Sep–Nov) | 1.0177 | +1.8% | In line with trend | 11 |
| FQ2 (Dec–Feb) | 0.9952 | -0.5% | In line with trend | 11 |
| FQ3 (Mar–May) | 1.028 | +2.8% | In line with trend | 10 |
| FQ4 (Jun–Aug) | 0.9974 | -0.3% | In line with trend | 10 |
How Spending Drives Revenue
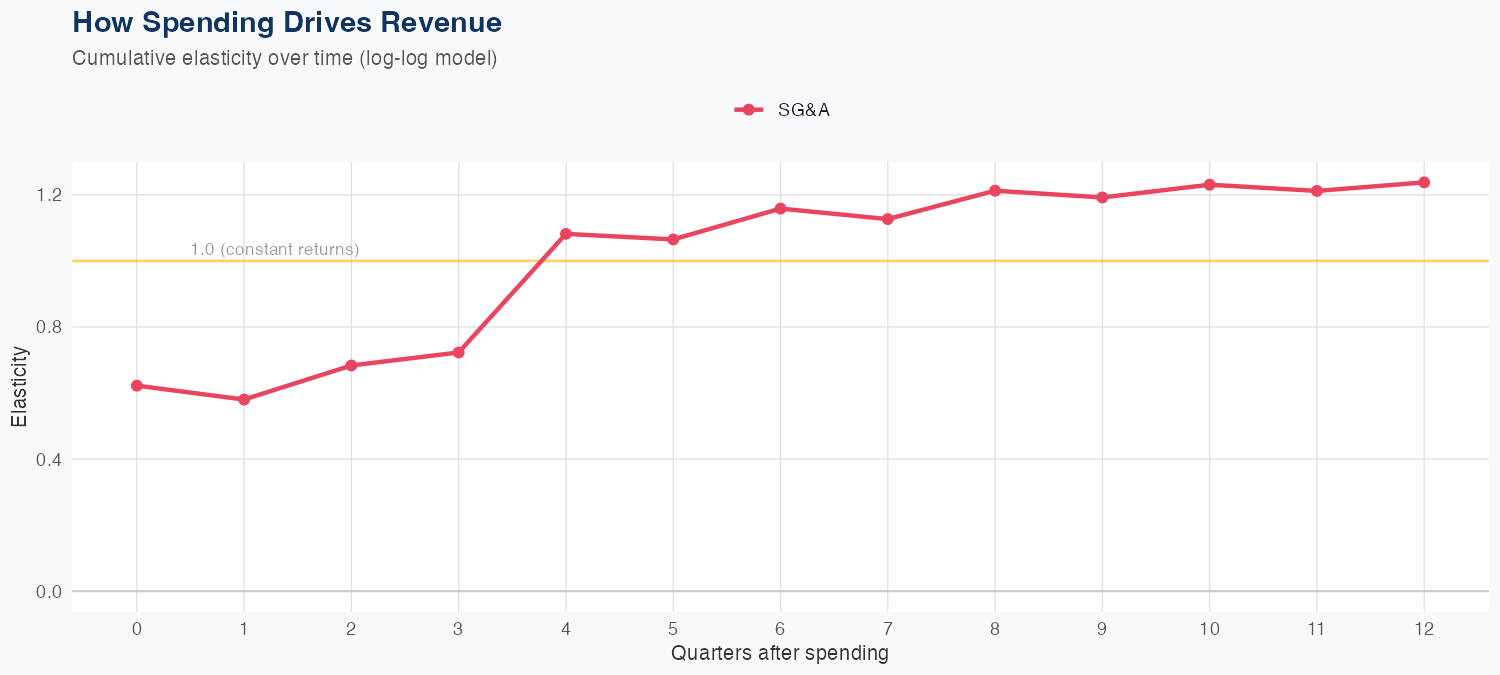
Spending Efficiency Over Time
Current SG&A elasticity: 0.6593x
Want this analysis for your portfolio?
I build custom revenue intelligence reports for investors and companies using SEC filing data, econometric modeling, and AI-powered insights.
Get in Touch