Rivian Automotive, Inc. / De RIVN
Revenue Intelligence Report • 21 quarters of SEC filing data • Updated 2026-03-15
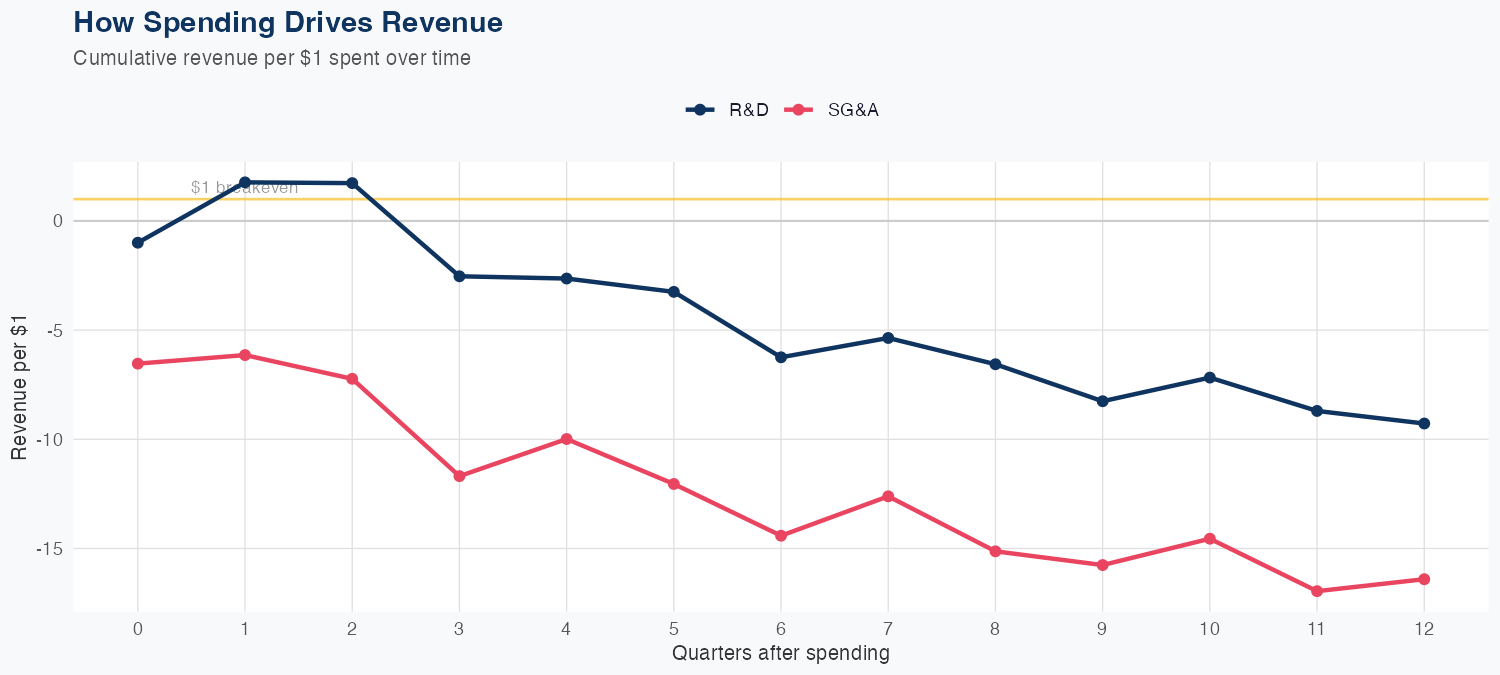
Latest quarterly revenue was $1.286 billion, with the full-year forecast around $5.4 billion, roughly flat year over year (-0.4% YoY). Using 21 quarters of data in a linear model, incremental R&D spending appears to reduce long-run revenue by $9.28 per dollar and SG&A spending by $16.41 per dollar, implying negative ROI for these expenditures under the current specification. Holdout testing produced a predicted $1.4 billion versus actual $1.3 billion (−10.8% error) with an overall MAPE of 14.7%, indicating only modest forecast accuracy and some model risk. With a flat top-line outlook and negative ROI from discretionary spending, investors should scrutinize spending efficiency and consider reallocating resources to restore revenue growth and margin trajectory.
Investment Thesis
At 14.7% MAPE, the model captures Rivian Automotive, Inc. / De's broad revenue trajectory, though quarterly variability suggests sensitivity to external factors.
Revenue Forecast
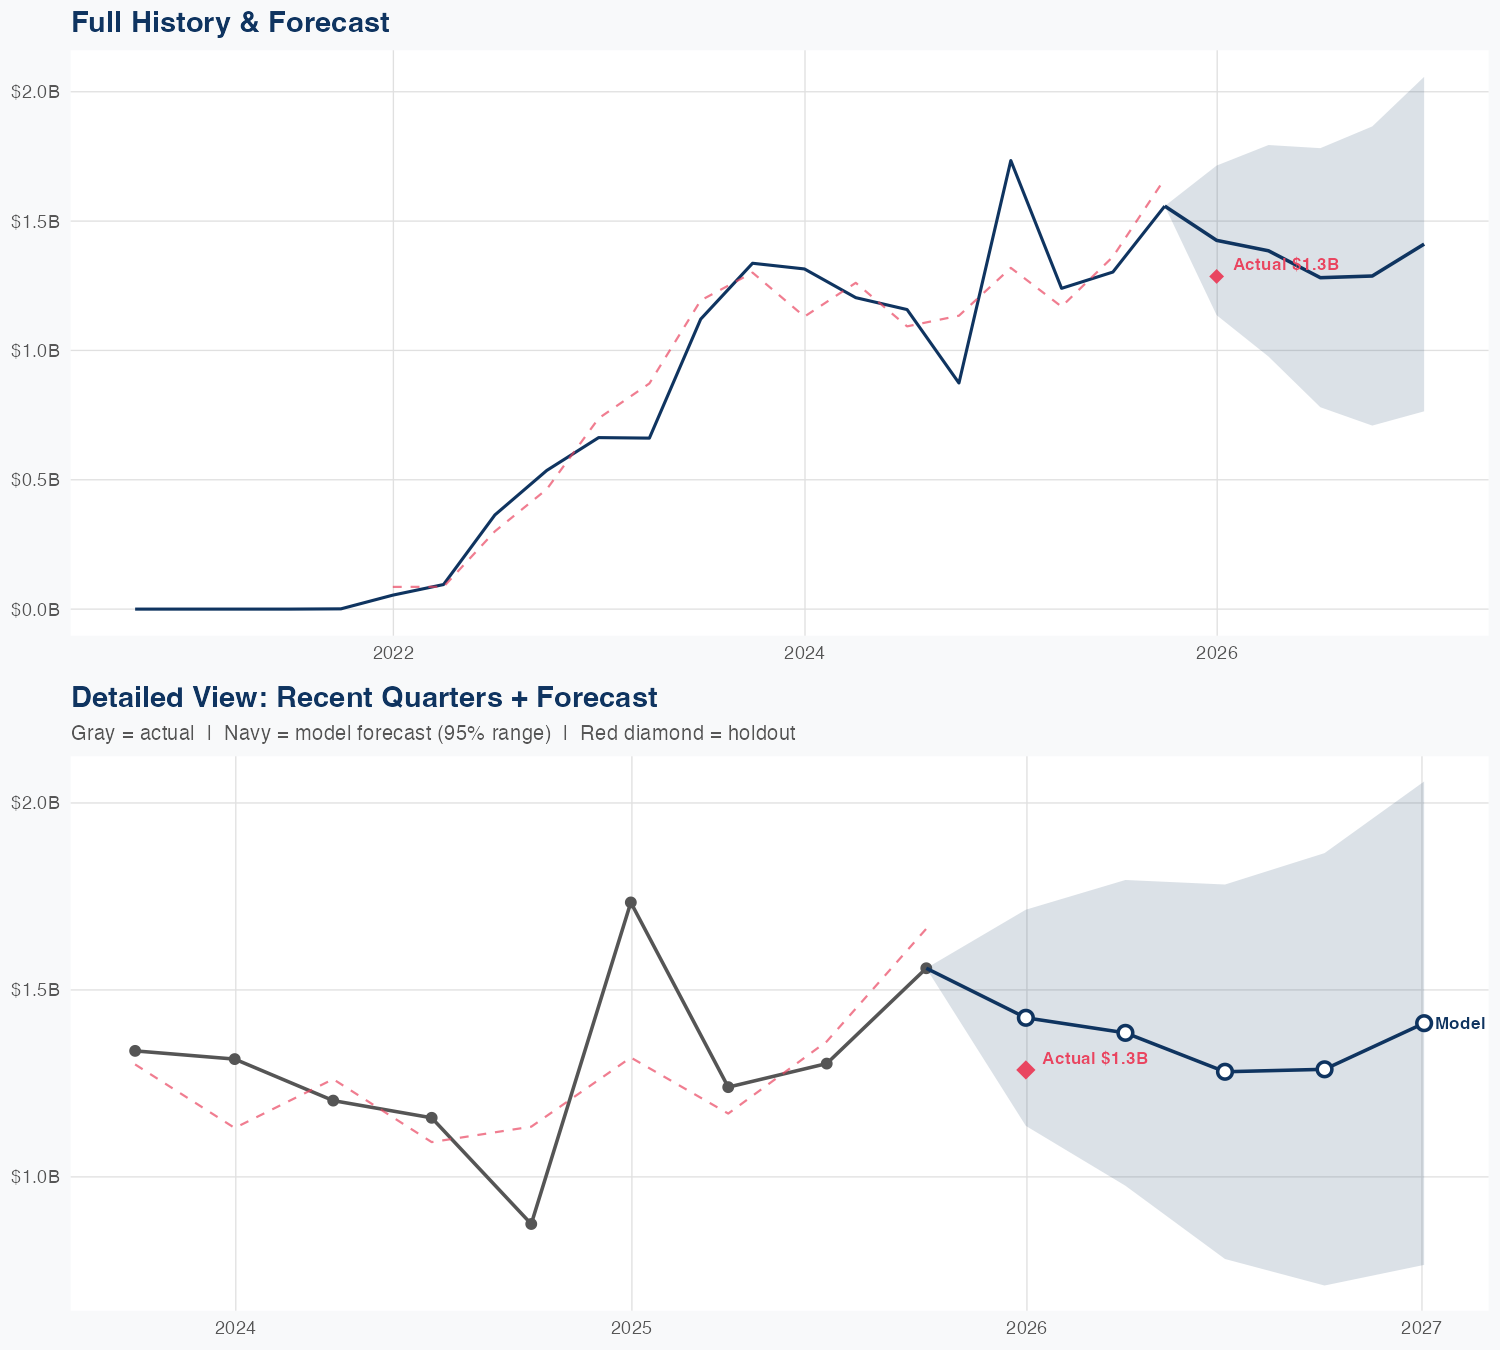
Quarterly Detail
| Quarter | Model Forecast | Actual | 95% Range | YoY Growth | Status |
|---|---|---|---|---|---|
| Q4 2025 | $1.4B | $1.3B | $1.1B – $1.7B | -17.8% | ✓ In range |
| Q2 2026 | $1.4B | $1.0B – $1.8B | +11.7% | ||
| Q3 2026 | $1.3B | $0.8B – $1.8B | -1.7% | ||
| Q4 2026 | $1.3B | $0.7B – $1.9B | -17.3% | ||
| Q1 2027 | $1.4B | $0.8B – $2.1B | +9.7% |
Seasonal Factors
| Fiscal Quarter | Seasonal Factor | vs Trend | Interpretation | Obs. |
|---|---|---|---|---|
| FQ1 (Sep–Nov) | 1.0279 | +2.8% | In line with trend | 4 |
| FQ2 (Dec–Feb) | 0.9674 | -3.3% | -3.3% below trend | 5 |
| FQ3 (Mar–May) | 1.0604 | +6.0% | +6.0% above trend | 4 |
| FQ4 (Jun–Aug) | 1.0595 | +5.9% | +5.9% above trend | 4 |
How Spending Drives Revenue
Want this analysis for your portfolio?
I build custom revenue intelligence reports for investors and companies using SEC filing data, econometric modeling, and AI-powered insights.
Get in Touch