Upwork Inc. UPWK
Revenue Intelligence Report • 33 quarters of SEC filing data • Updated 2026-03-15
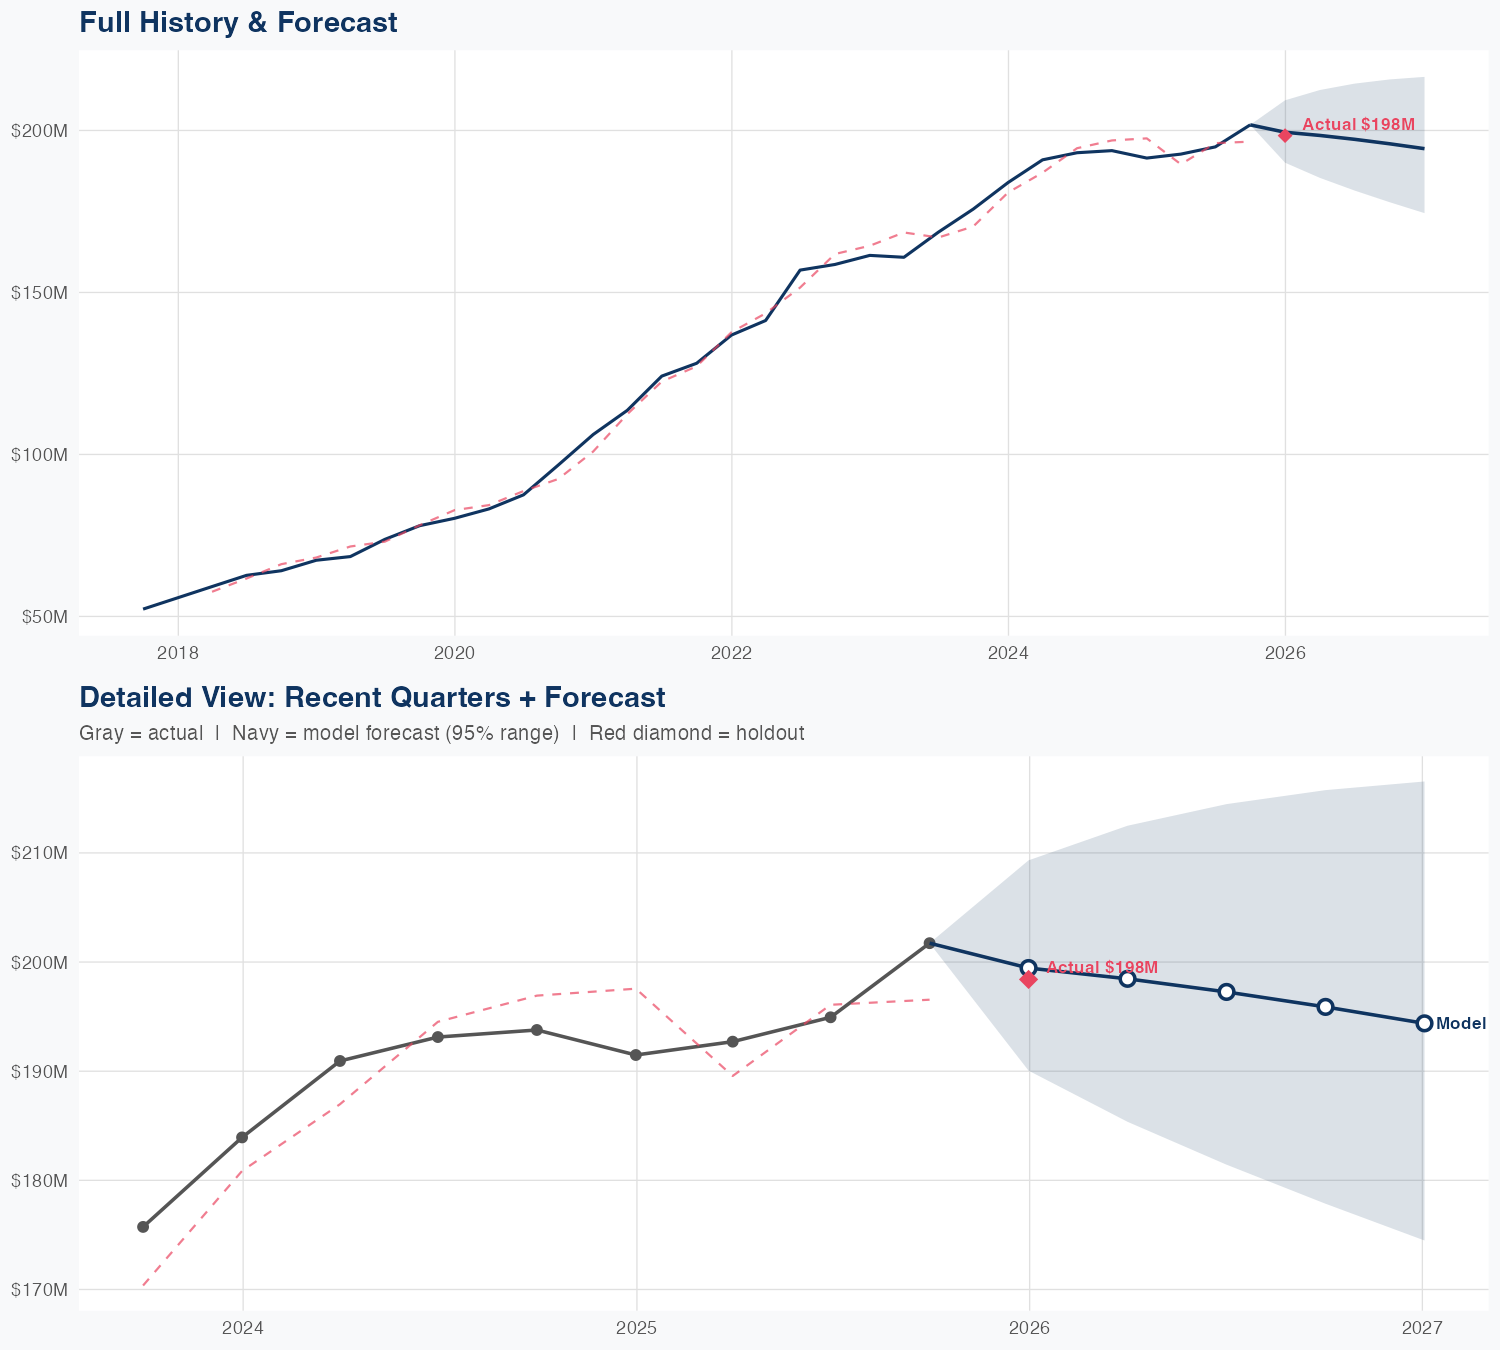
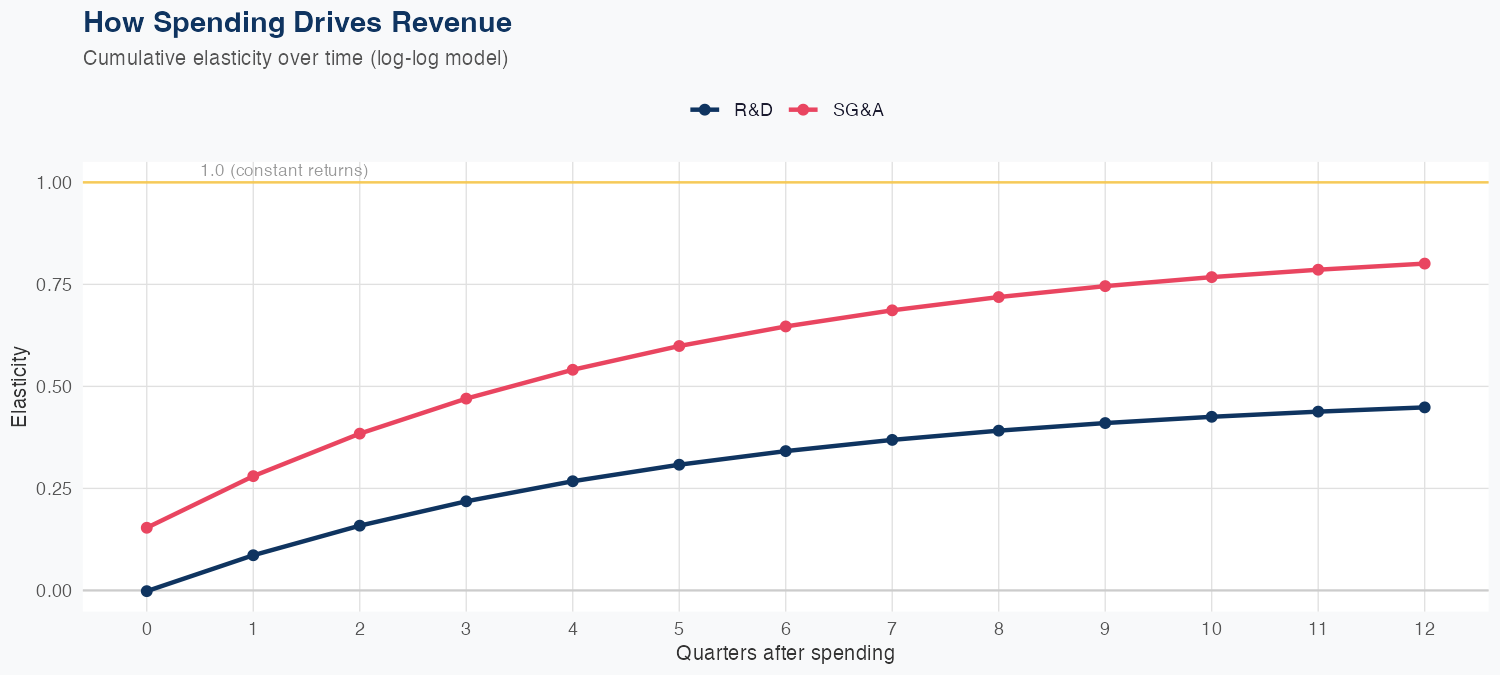
Latest quarterly revenue was $198M, and in a log-log model revenue responds to cost spending with elasticities of 0.45% per 1% in R&D and 0.80% per 1% in SG&A. SG&A spending shows stronger revenue leverage than R&D, implying a higher ROI from efficiency-driven marketing and operating expenses relative to product development. The model is reasonably accurate, with a 2.1% MAPE and a holdout test error of -0.5% (predicted $199M vs actual $198M), supporting its use for near-term planning. The FY forecast calls for about $786M in revenue, essentially flat to down 0.2% YoY, signaling modest topline growth and suggesting investors should prioritize optimizing the expense mix to sustain revenue with controlled costs.
Investment Thesis
Our ARDL model tracks Upwork Inc.'s revenue with exceptional precision (2.1% MAPE), indicating highly predictable cash flows. R&D investment shows a 0.45x multiplier — each 1% increase in R&D spend is associated with a 0.45% revenue increase, signaling strong innovation-to-revenue conversion. Sales & marketing spend shows a 0.80x elasticity, suggesting effective go-to-market execution.
Revenue Forecast
Quarterly Detail
| Quarter | Model Forecast | Actual | 95% Range | YoY Growth | Status |
|---|---|---|---|---|---|
| Q4 2025 | $199M | $198M | $190M – $209M | +4.2% | ✓ In range |
| Q2 2026 | $198M | $185M – $212M | +3.0% | ||
| Q3 2026 | $197M | $181M – $214M | +1.2% | ||
| Q4 2026 | $196M | $178M – $216M | -2.9% | ||
| Q1 2027 | $194M | $174M – $217M | -2.0% |
Seasonal Factors
| Fiscal Quarter | Seasonal Factor | vs Trend | Interpretation | Obs. |
|---|---|---|---|---|
| FQ1 (Sep–Nov) | 1.0074 | +0.7% | In line with trend | 8 |
| FQ2 (Dec–Feb) | 0.9878 | -1.2% | In line with trend | 8 |
| FQ3 (Mar–May) | 1.0105 | +1.0% | In line with trend | 8 |
| FQ4 (Jun–Aug) | 1.0099 | +1.0% | In line with trend | 8 |
How Spending Drives Revenue
Want this analysis for your portfolio?
I build custom revenue intelligence reports for investors and companies using SEC filing data, econometric modeling, and AI-powered insights.
Get in Touch