Blackstone Inc. BX
Revenue Intelligence Report • 66 quarters of SEC filing data • Updated 2026-03-15
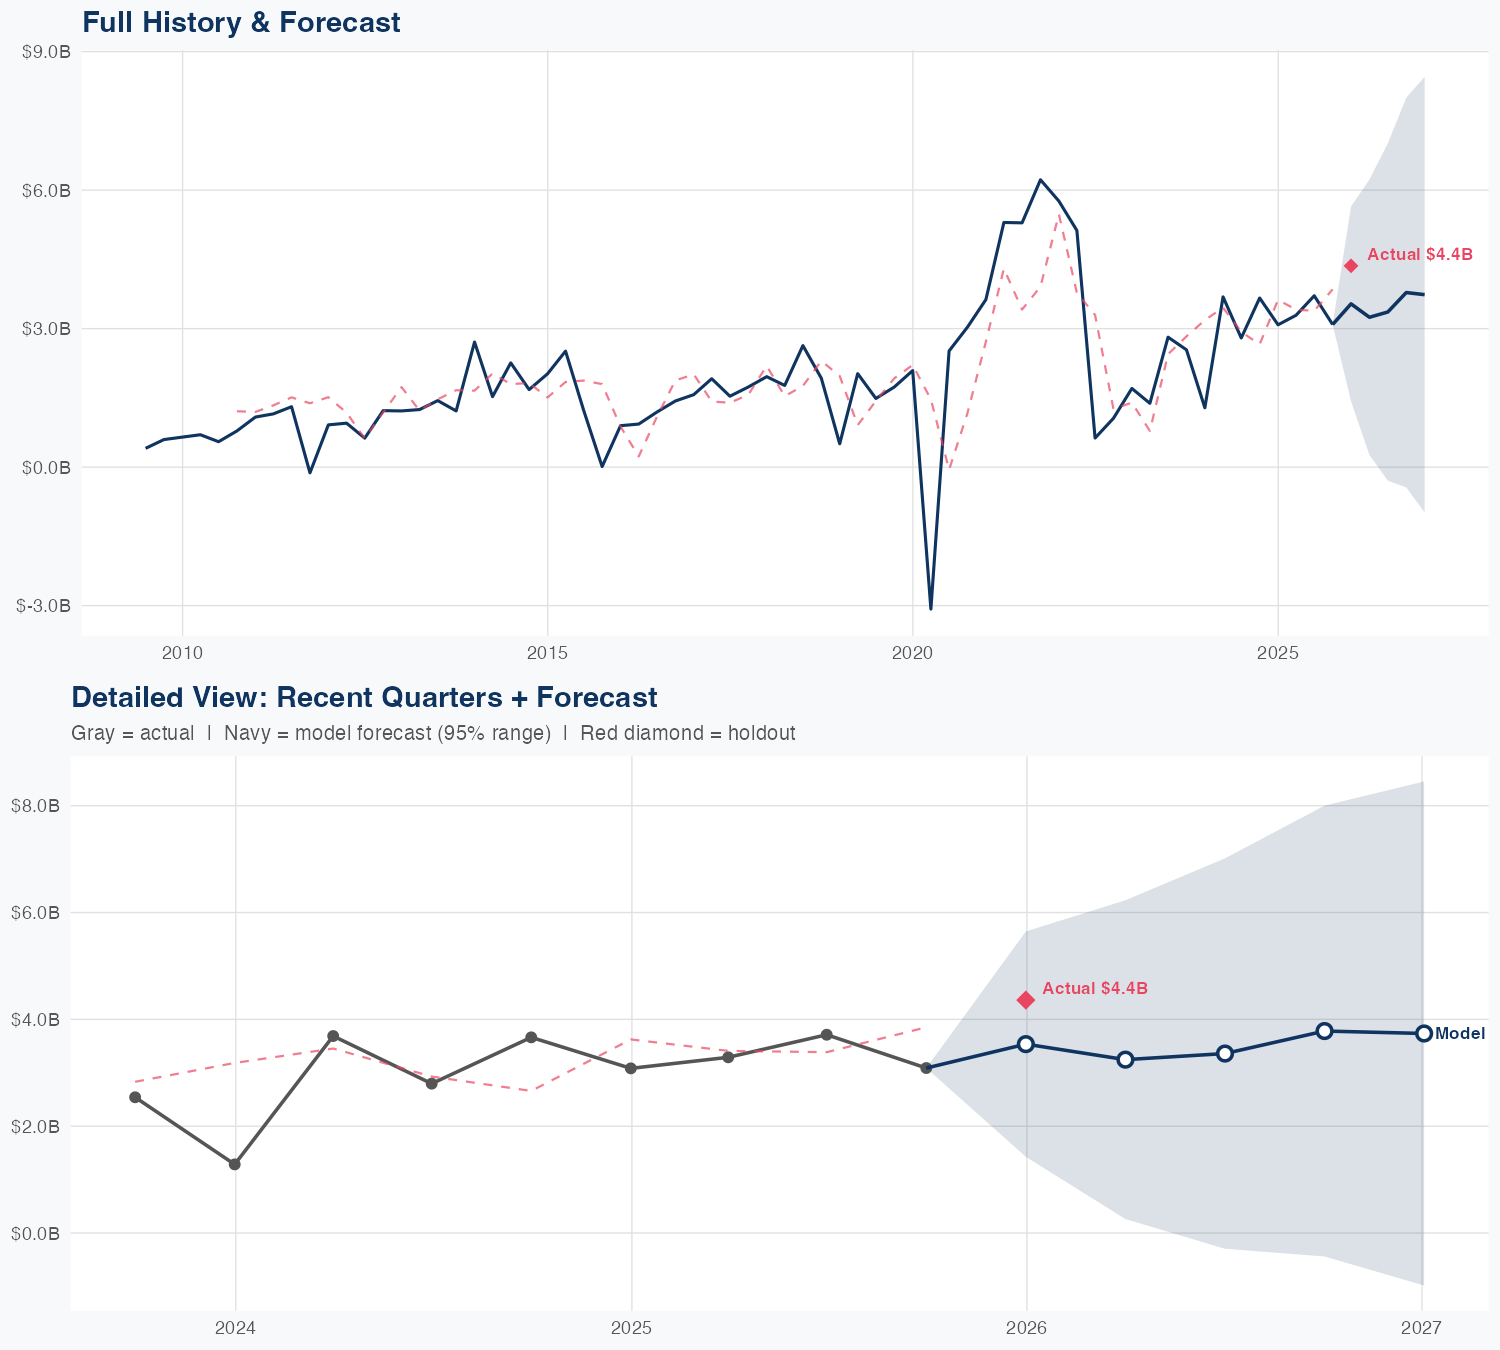
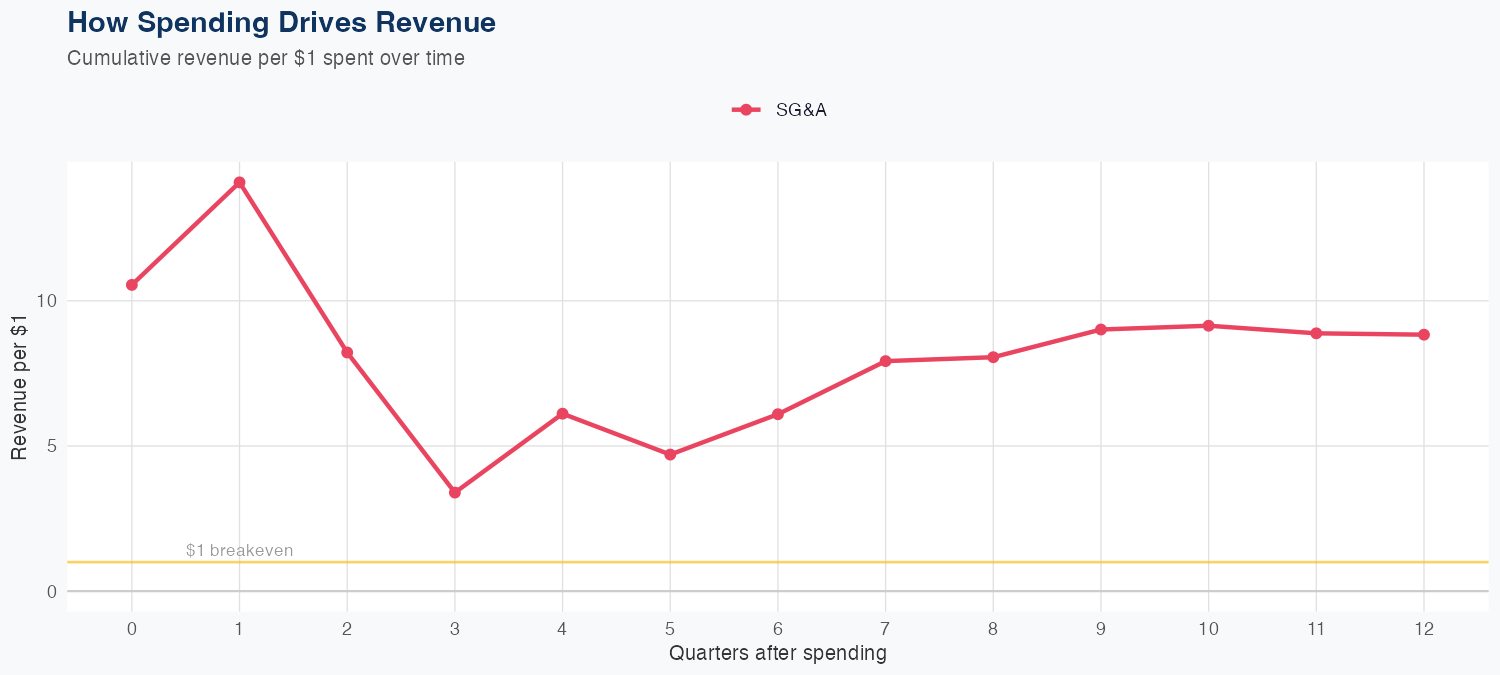
Revenue hinges on SG&A spending, with a linear model projecting that every $1 of SG&A generates $8.83 in long-run revenue. However, model accuracy is poor (306.3% MAPE), and out-of-sample tests miss the actual result by about 18.9% (predicted $3.5B vs $4.4B). The latest quarterly revenue is $4.36B, supporting an annual run-rate near the $14B forecast. The FY outlook calls for roughly $14B in revenue, down about 2% year over year, implying modest top-line pressure but potential upside if SG&A-driven leverage proves durable.
Investment Thesis
At 306.3% MAPE, the model captures Blackstone Inc.'s broad revenue trajectory, though quarterly variability suggests sensitivity to external factors. Each $1 of SG&A spending generates $8.83 in revenue, reflecting strong commercial efficiency.
Revenue Forecast
Quarterly Detail
| Quarter | Model Forecast | Actual | 95% Range | YoY Growth | Status |
|---|---|---|---|---|---|
| Q4 2025 | $3.5B | $4.4B | $1.4B – $5.6B | +14.7% | ✓ In range |
| Q2 2026 | $3.2B | $0.3B – $6.2B | -1.3% | ||
| Q3 2026 | $3.4B | $-0.3B – $7.0B | -9.5% | ||
| Q4 2026 | $3.8B | $-0.4B – $8.0B | +22.4% | ||
| Q1 2027 | $3.7B | $-1.0B – $8.5B | -14.3% |
Seasonal Factors
| Fiscal Quarter | Seasonal Factor | vs Trend | Interpretation | Obs. |
|---|---|---|---|---|
| FQ1 (Sep–Nov) | 0.8976 | -10.2% | -10.2% below trend | 16 |
| FQ2 (Dec–Feb) | 0.9454 | -5.5% | -5.5% below trend | 16 |
| FQ3 (Mar–May) | 1.151 | +15.1% | +15.1% above trend | 15 |
| FQ4 (Jun–Aug) | 1.094 | +9.4% | +9.4% above trend | 14 |
How Spending Drives Revenue
Want this analysis for your portfolio?
I build custom revenue intelligence reports for investors and companies using SEC filing data, econometric modeling, and AI-powered insights.
Get in Touch